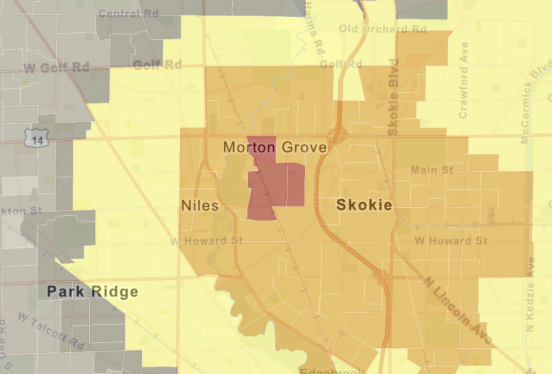
Morton Grove is a neighborhood of 22,943 people that runs along the North Branch of the Chicago River a few miles northeast of the city. I was drawn to Morton Grove and intrigued by its story because I live in a neighboring community. The EPA has identified five factories in Morton Grove as hazardous waste treatment, storage, or disposal facilities; there is a disproportionately high amount of hazardous waste sites in this community considering its small size and the absence of hazardous waste sites from many of the surrounding neighborhoods. Why is there a disproportionate amount of facilities storing, disposing, or transferring hazardous waste in Morton Grove? I began responding to this research inquiry by looking at the infamous maps created by the Home Owner’s Loan Corporation between 1935 and 1940 which are responsible for mass racial segregation and socioeconomic stratification in America. I found a map created in 1940 with a distinct section of Morton Grove marked “definitely declining” because of its “doubtful future” and poor reputation. This distinct section is the area that is now zoned as a manufacturing and residential district and home to the five hazardous waste sites. My project examines how the legacy of housing discrimination is visible today in the disproportionate siting of hazardous waste facilities. Morton Grove has a higher minority population than surrounding neighborhoods and more people below the poverty line. My visual project represents the trajectory of environmental bads and how they come to be located in vulnerable demographic pockets of our country.
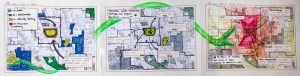
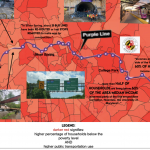
I have created a series of three images to tell this story of unjust sustainability. The foundation of each chapter is the map from 1940 to remind the viewer of the powerful legacy of housing inequality. In Chapter One: Once upon a time in 1940 the area of Morton Grove that was marked “definitely declining” is visible as well as a quote that went along with the areas C grade designation. Chapter Two: Siting of Hazardous Facilities shows the locations of hazardous waste treatment, disposal, and storage facilities and when they moved into the neighborhood. This is an important visual because all the facilities are located within the yellow section of Morton Grove. Chapter Three: 80 years later in Morton Grove contrasts the extreme level of hazardous waste in Morton Grove with the surrounding communities. I include information on three specific chemicals that are being released into the community and the health hazards they pose to the community of Morton Grove.


bascolot
May 1, 2020 — 5:50 pm
Hey Claudia,
I love the effort that you put on your visuals. Having found those maps must have been a great step in your research and of great help for the presentation of your findings. The details of the maps that you were able to produce are great, and I love the artistic touch that you gave it with the snake. It seems to have great symbolic strength and mostly when you see that in your maps green is labeled as the presence of all of the five hazardous waste that you study. Was that intentional?
Great job!
Claudia
May 1, 2020 — 6:27 pm
Thank you for your thoughtful comment! I did intentionally coordinate the color of the snake with the hazardous waste sites. I wanted to tie hazardous waste with a symbol of danger. Danger that slowly slithered from 1940 to present day, where it devoured the neighborhood.
messimeg
May 1, 2020 — 6:18 pm
I love your visual! It looks like you put a lot of effort into the series of pictures and really showcases the problem and was done so well! Seeing the concentration of hazardous waste sites in minority populations like this really proves how unjust this is, and I think the way you presented this really brought that to light. Great job!
Claudia
May 1, 2020 — 6:31 pm
Thank you! I am glad to hear that you found my art project effective in expressing the injustice in Morton Grove.