The World’s Beaches in a State of Flux

Beaches. You love them, I love them, everyone loves them. In fact, 1.5 billion people or about 20% of the worlds population live along them and the coast.  And if you don’t live on them you probably enjoy visiting them as they’re huge hot spots for tourists. Beaches are typically very industrialized and booming with infrastructure, meaning high economic value. About 31% of all beaches, not along the arctic poles, are sand beaches. The thing is, these beaches are extremely variable and are constantly changing. In a recent study published by Scientific Reports, a group of researchers found that the majority of sandy beaches around the world are in flux. What this means is that many of the beaches are either eroding away or  are in accretion (growing).

Over the course of 30 years (1980-2016), the study found that 24% of the worlds sandy beaches are eroding by more then an average depth of 0.5m/yr a year, that 17% of the worlds sandy beaches are eroding by over a depth of 1m/yr, and that 27% are experiencing accretion rates of over 0.5m/yr. The study found that less then half of the worlds sand beaches are stable (48%), with all the rest changing in size, some at massive rates.

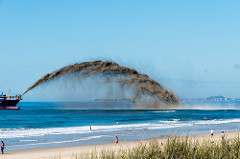
Although it may seem counter intuitive, the private, government protected beaches around the world are the ones most susceptible to erosion. And the highly industrialized, tourist beaches are most commonly undergoing accretion. The reason behind this is almost entirely due to human intervention. For the huge, public tourist ones, governments have been implementing ways in which to manually regrow the beaches. The two main ways this is done is by protecting them with different types of sea walls, concrete structures built to reduce erosion, or by dredging, where offshore boats literally take sand from the ocean and spray it back onto the beach.

Dredging
Boat dredging a beach.                              Photo by David Morgan

The study also found that the two main reasons for beaches eroding was also anthropologically caused. The first being sand mining and subsidence, meaning sand is being mined from shorelines for industrial use. The second being big coastal structures such as harbors and ports causing incoming sediment to the beaches to be blocked off.

The take away; beaches are drastically changing and its mainly in part to humans. Much of the worlds population lies along the coast lines and its important to be informed about what is happening to them. This study was one of the first global studies done in order to show what’s happening to specific sand beaches all over the world as well as explain the reasons behind them. Lastly, the study found that for the most part protected beaches are quickly eroding away, raising cause for serious concern.

Who knows how these rates of change will be affected as sea level continues to rise, for more information about the study visit https://www.nature.com/articles/s41598-018-24630-6 .

Source

Luijendijk, A., et al. 2018. The State of the Worlds Beaches. Scientific Reports 8. 6641: 10-38.

The True Swine of America

Wild Boar

Invasive species put a huge stress on local environments and bring with them many problems, especially when it comes to native species. Invasive species are those not native to an area, and are typically introduced to new regions through human intervention. One of the most problematic invasive species today is the wild boar. Although only native to Eurasia and Northern Africa, wild boar can currently be found in every continent in the world excluding Antarctica. They were first introduced to the United States by Spanish explores in the 16th and 18th centuries and have since spread all across the southern parts of the country.

Wild pigs are pose a huge problem in the United States. Each year the U.S Department of Agriculture spends 20 million dollars for the purpose of repairing agricultural and structural damages caused by wild boars. The boars themselves are extreme generalists in diet and habitat meaning they can survive in many different climates and eat a huge range of plants and animals. They also reproduce prolifically and are known as ecosystem engineers meaning they are disruptive to their habitats as they tend to root and wallow the soil. Lastly, these feral hogs tend to populate some of the most bio diverse areas of the the United States (California and the Southeast), and thus disrupt many already imperiled species.

A study done under the USDA-APHIS-Veterinary Services found that 141 imperiled species across the U.S are susceptible to wild boar encounters and impacts. By using previously population spread data for boar and native species, researchers found that 72.7% of imperiled species in the U.S have wild pig range overlap and thus are susceptible to them. Crustaceans being predicted to be most at risk. The study also found that the Southeast, Southwest, and Pacific Southwest regions of the U.S have the biggest boar populations with boars spanning 72.9%, 62.6%, 41.3% of each area respectively.

Within the study the researchers also note that the wild boars are expected to continue their expansion of the United States and expect over 1,000 more watersheds to be infested with them by 2025. Furthermore, the scientists noted that no studies have ever effectively take into account the damages brought along by the many diseases and parasites the boars carry or of resource competition with other species they cause. Thus, many of their estimates for boar impacts and costs could be underestimated.

In conclusion, wild boars are destroying regional species and are taking over many ecosystems. Its clear that more research needs to be done on the full extent of their damages to local habitats as well as in ways humans can stop these beasts from continuing to terrorize the worlds environments. For more information visit https://www.nature.com/articles/s41598-018-23657-z.

Source

McClure, M. L., et al. 2018. A globally-distributed alien invasive species poses risks to Unites States imperiled species. Scientific Reports, 8 (5332).


There’s a Reason They’re Called Floodplains

Since the start of mankind, rivers have played a vital piece in fostering colonies and settlements. The Mississippi is no different. The 3,800 kilometer long river and its floodplains host many farms and population centers. To help protect this infrastructure, river controlling devices such as levees, dams, and walls line the exterior of the river to help prevent flooding events. However, new studies show that these barriers might be causing higher frequencies and magnitudes of massive flooding events.

Research done across a number of different colleges, including Northeastern University, found that residents within the Mississippi floodplains could be in major trouble. By using a number of different methods including studying past stream flow data, past sedimentary samples, historical climate data, and current tree-ring lines, the researchers found that the river’s massive flooding events (100 year events) have increased by over 20%  and have seen an amplification of flood magnitudes over the last 500 years. They also found that 75% of this increase is due to human modifications of the river and its basin. The other 25% was found to be climate related.

Flodding
Aerial view of flooding of the Mississippi in Arkansas 2011 (photo by Lance Cheung)

The confinement of the rivers channel which occurs in part to the levees, is good at alleviating small flood risks but hugely magnifies ones that are able to over top them. Anthropogenic modifications to the river’s channel which began to appear in the early 20th century was seen to have a direct correlation with these more powerful flooding events. The rivers manipulated channel allows for little room to expand during flooding events, in order to protect the many farmlands and cities which line the exterior of it. This less natural flow channel means that when floods actually do surpass the protections in place to stop them, they do far more damage then they would have had the walls not been there in the first place.

Further problems arise when economic costs come into play. Because the rivers banks are so highly populated its almost impossible to relocate infrastructure already in place which would allow the river to take a more natural course. The lower half of the Mississippi river in particular is most in danger to flooding and thus has higher economic problems which occur when events top the levees. The researchers who conducted the study also predict the magnitude and frequency of mass flooding events of the Mississippi river are only going to continue to grow. This leaves the government in a tricky spot, should we start funding huge, extremely difficult and costly relocation projects or further risk devastating flood hazards by continuing artificial channelization.

For more information visit https://www.nature.com/articles/d41586-018-04061-z.

Source

Munoz, S.E., et al., 2018. Climate control of Mississippi River flood hazard amplified by river engineering. Nature. 556, 95-98.

Sea Ice, Warming, and Bears Oh my

Whenever I think of global climate change one of the first images that pops into my mind is that of a polar bear stranded out on a glacier. To me this image alluding to the polar bear’s ‘impending demise’ has in a way become s a rallying point in the fight against global warming. Polar bears always seem to be brought up in conversation when talking about issues that are caused by global warming, yet in the past there’s been little known information about the actual details causing the polar bear’s declining population.

Polar Bear
Polar Bear jumping between masses of ice

Receding and changing sea ice conditions throughout the Arctic is mostly to blame. However, further details of why that is has been relative limited until fairly recently. Researchers from around the U.S. as part of the U.S. Geological survey, Alaska Science Center, attempted to find out more on these causing mechanisms. By simultaneously measuring a number of factors in polar bears lives including body condition, field metabolic rates, daily activity patterns, and their foraging success, the scientists found high metabolism rates and a deficiency in fat-rich food sources resulted in about half of the bears studied having far less energy intake then they should. For 91% of the polar bears time studied (8-11 days each), the animals were located on sea ice, meaning their food source would come almost entirely from ringed seals. Over a course of 10 to 12 days, 1 ringed seal adult, 3 sub-adult ringed seals, or 19 newborn ringed seal pups are needed simply to break even in energy needed to survive as a freelance bear. However, with reducing amounts of sea ice, scavenging for this food source becomes harder and harder. The researchers observed that 4 of the 9 bears lost over 10% of their fat in the 8-11 days they were observed.

What the researchers also found was that during late spring/early summer time, when the bears are supposed to be gaining weight for the coming winter, polar bears would not be able to reach their goal of 1kg of wight to 1kg of lean body mass (the preferred fatness) unless they either reduced their energy demands or increased food consumption. Yet, these two motives are much easier said then done. The polar bears energy needed for survival is directly correlated with how far the polar bears have to roam around in order to find their next meal. And with the fragmenting sea ice caused by global warming the distance they have to travel increases each year leading to increased amounts of energy being used. The end result, is that these fragmentation’s could be a big factor in the declining body condition and mortality of this species.

Source:

Pagano, A. M., et al. 2018. High-energy, high-fat lifestyle challenges an Arctic apex predator, the polar bear. Science Magazine, V. 359(6375): 568-572.

Coral Reefs getting Slammed, This Time Plastics are to Blame

Coral bleaching isn’t the only major issue affecting our coral reefs. Plastic waste is once again damaging marine life, this time in the form of the coral reefs. Scientists around the world including those at Cornell University and James Cook University in Queensland, Australia found that corals entangled in plastic are more likely to be infected with pathogens and diseases then ones which aren’t.  These scientists surveyed 159 coral reefs and visually examined over 120,000 individual corals all throughout the Asia pacific region. Of the corals surveyed, 1/3 of them were wrapped in at least one piece of plastic greater then 50mm amounting to 2.0-10.9 plastics per 100m2. It was then found that corals within the presence of plastic waste saw a likelihood of contracting a disease increase by more than a factor of 20 to 89.1 ± 3.2%. This is a significant jump from that of the normal rate in corals which is 4.4 ± 0.2%. Given the widespread distribution of plastic debris on coral reefs and the continued pollution rates,  by 2025 it was estimated that if everything continues as it is, over 15.7 billion plastic items will be wrapped up in coral reefs, meaning huge increases in mortality rates, which 3/4 of the plastic debris causing diseases eventually lead to.

Plastic bag on Coral
Plastic bag entangles in coral

With over 275 million people worldwide relying on coral reefs as food sources, this plastic waste is a major problem. The hard part is, plastics aren’t uni-formally distributed. More waste is found closer to poorer regions of the world, as they tend to recycle less and pollute more. These third world countries also tend to rely more heavily on the ocean, particularly coral reefs, as their main food source, thus this phenomenon is only gonna affect them to a higher degree. For example the study found Indonesia (a third world country) had the highest amount of plastic debris in their surrounding regions and thus also had the highest percentage of coral reefs in contact with plastics, compared to everywhere else studied

The overall impact? Not good. It has been stressed over and over again and will continue to be; waste management is a must. Decreasing amounts of debris that enter the ocean is imperative to marine life as well as our own. It is vital that we reduce the amount of plastic on our coral reefs and thus the associated diseases they cause.

Source

Lamb J. B. et al., 2018. Plastic waste Associated with Disease on coral reefs. Science Vol. 359(6374): 460-462.

Another Incoming Climate Change Victim?

Ocean acidification, arguably climate change’s worst product where CO2 which has been released into the atmosphere is then absorbed by the ocean effectively lowering its pH level, is yet again being proven to negatively affect marine life. This time, a few researchers at the Tjärnö Marine Research Station in Sweden conducted a year and a half long experiment on ocean acidification’s affect on a marine invertebrate known as Balanus improvisus, a type of barnacle known to be sensitive to short term changes in ocean pH levels. The study took reared laboratory bread barnacles as well as field collected assemblages, and held some of each under normal ocean pH levels of 8.1 and  a more acidic level of 7.5. Their results, were sadly quite predictable. 

The acidification not only caused the barnacles mortality rate to heavily increase, but also led to reduced growth and reproduction rates. In fact, barnacles were even paired up with one another so as to increase breeding rates, yet still both the laboratory made and field collected samples held in the more acidic water, failed to produce any fertilized embryos. Though most of the surviving barnacles of the acidic water developed mature gonads ( organs used for reproduction) in the end they all failed to reproduce over the 16 months studied, meaning they were able to acclimate to their new environment, but only partially.

Barnacles
Group of barnacles

The two big aspects to take away here are firstly, that barnacles are ecologically important, economically important, and widely studied ecosystem engineers that if lost would be awful for marine environments and future studies on the health of environments. Secondly, that this study proves once again that climate change, specifically ocean acidification is detrimental to marine life across all aspects.  So much aquatic life is quickly disappearing due to this phenomenon as well as ocean temperature risings, both of which are direct products of global warming. Sadly, these invertebrate are just another example, in a sea of them (pun not intended), of the major issues that are headed our way if we don’t reduce our carbon emissions.

Source

Anil A. C., 2018. Long term exposure to acidification disrupts reproduction in a marine invertebrate. PLoS One V. 13(2): 19-36.

For Better or Worse Rock Glaciers will Eventually Melt Away

As global climate change continually progresses our glaciers continually recede. However, their decreasing volumes differ from one to another. You may never have heard of them, but rock glaciers (RG’s) are the more resilient, mountainous equivalent to typical glaciers. Researchers in the BEIS/Defra Met Office Hadley Centre Climate Program, conducted research regarding these glaciers and created the first ever RGDB (rock glacier database), in an effort to increase knowledge about them and awareness of the impending hydro-logic impacts they soon may have. They were able to pinpoint over 73,000 of them all over the world, many of which were located in the highest and most arid regions of the world, including the Andes and the Himalayas.

As stated earlier rock glaciers are more resilient to low lying glaciers (in regards to global warming).  RG’s are found in high elevation area’s, mainly mountain tops, all around the world. They have an active layer which melts and thaws seasonally, and are characterized as active or inactive glaciers depending on whether or not they have ice beneath it. This active layer is also what helps regulate the glaciers temperature and causes it to be more resilient to temperature changes. However, they aren’t immune. Global warming is predicted to hit higher elevation areas harder then lower lying elevations. At first this will increase flow of rivers and streams within the watershed, but it won’t last for long. As the temperature increases so will melting and eventually the long term future consequence will be the loss of these glaciers.

Glacier and Snow on Mountain
Mountain glacier and snow in New Zealand

Thankfully, the water supply that will eventually come from the melting of these ‘natural water towers’ isn’t just gonna disappear, it’ll be utilized. The meltwater will create a significant water source for arid and semi-arid systems with potential future water scarcity problems.

Apart from the database made, the researchers also estimated the water content that individual rock glaciers hold. The number came to around 83.72 Gigaton each, give or take about 16Gts. That’s a lot of water, especially if used efficiently.

Finally, whether or not individual rock glaciers melt, people in places affected by them wont see huge droughts anytime in the near future, thanks to their resilience to climate change. The only question left is, what happens when they do finally melt away?

Source

Jones D. B, Harrison S., Anderson K., Betts R. A., February 2018. Mountain rock glaciers contain globally significant water sources. Scientific Reports v10 NO 1038: 28-34.

Data Sharing; How it Helped These Tropical Bears

Although you may never have heard of them before now, Helarctos malayamus better known as Sun bears (yes, believe it or not moon bears exist too),  are the smallest species of bear in the world.  These bears can be found in tropical forest habitats in Southeast Asia, but are sadly on the IUCN vulnerable species list.

Yet another animal attempting to survive in our growing anthropogenic world, the Sun Bear has seen a population loss of over 30% in the last few decades. This decrease is almost entirely in part to deforestation, and researchers at the university of South Carolina have good reason to believe these number aren’t slowing down anytime soon.  Using data captured from 1,463 non-baited camera traps spanning over 31 field sites all within Sun bear territory, the team found that there’s a direct correlation between tree cover and sun bear presence.  The bears were only seen in areas with over 20% cover (over a span of 6km^2 from the camera) and were 146% more likely to be found in areas with 80%+ tree cover then that of only 20%+.

Sleeping Sun Bear
A sun bear snoozes on a tree

A very interesting aspect of their study was the camera traps, which work by turning on and recording every time they sense movement in the area in front of them, weren’t specifically set up to find Sun bears. They were setup for a number of other studies being done on other species. However, the camera data was borrowed and used to collect population information on the Sun Bears which in regards to the other studies, was a byproduct. This reuse of data led to the findings of strong evidence in support of diminishing Sun Bear numbers, and has the potential to do it time and time again with completely different species.

The future implications on this are endless. If studies using camera traps to interpret information on one specific species, were to share they’re data across the world to other researchers attempting to learn something about completely different species found in that area. Then potentially huge knowledge gaps on all types of animals could be filled, and this doesn’t even include the economic proficiency that would come of it.

The overall takeaway is that if so much can be learned about our small bear friends in Southeast Asia using recycled camera footage (and knowledge from experts), who knows what else could be learned about other animals in that footage or other camera trap studies.

Source:

Mousseau T., 2017. Projecting range-wide sun bear population trends using tree cover and camera-trap bycatch data. PLoS One NO 12(9): 56-68.


Microplastics; Yet Another Growing Environmental Catastrophe

Since their discovery in the mid 1970’s, plastic pollutants have increasingly become a major issue. Today millions of tons of plastic can be found in our oceans and rivers. ‘Plastic Islands’ which have formed from water currents, have been discovered floating around in the oceans. These islands can stretch for miles and continue to grow with every passing day, the biggest one the Great Pacific garbage patch is located off the coast of Hawaii.  Plastic pollutants are a major threat both aesthetically and biologically to the worlds water systems, and yet the threat extends past this.

Microscopic plastics pose the largest threat. Microplastics are those that range between 1-5 micrometers in length. They can either be intentionally manufactured, and made for use as raw material, pellets, microbeads, or by the slow degradation of bigger plastics in water environments. These pollutants can make their way into the water environment through a number of different ways including wastewater treatment plants, fisheries, cargo shipments, and urban runoff.  Scientists at the University of Bielsko-Baila in Poland noted that wastewater treatment plants (WWTP’s)  were one of the main sources that introduced micro plastics into freshwater, and that rivers were the main means of transporting these plastics into the ocean.  These ideas were backed up by stating that after treatment, wastewater was found to contain on average 8.6 particles and 4.9 fibers (microplastics which deteriorated from bigger plastics) per liter.

Microplastics
Small beads and tiny bits of plastic that are commonly found in the ocean.

But why does this matter, what’s so bad about a few bits of plastic floating around?

Well for one, plastics don’t dissolve and disappear, once manufactured they’re in the system for good.  As stated earlier, when these plastics make it into water, they disintegrate into smaller and smaller pieces eventually becoming microplastics. Apart from the plastics being relatively displeasing to look at and causing economic loss in terms of tourism, the more serious issues come into play when water organisms mistake them for food. Plastic when ingested can be toxic and can cause all sorts of different issues, including rapid death. The problems continue when human consumption of these organisms is brought into play, and although the extent of these problems isn’t fully understood more research is currently being done to test the harmful causes of consuming seafood containing bits of plastic.

Plastic pollutants have been a long standing issue and as long as our ocean and waterways contain plastic, it will continue to be an issue. The hard part about plastics is even if we were to completely stop all production of them at once, the millions of tons of plastic in the ocean right now wouldn’t just disappear, they would continue to persist. Personally, I believe much more political action as well as scientific research needs to go in to figuring out how to find alternatives to plastic so as to lesson its impact on our environment. However, if consumption continues on the trend it has, microplastics will have something to say for ocean biodiversity and human health.

Source:

Mrowiec B., 2017. Plastic Pollutants in Water Environment. De Gruyter 28 NO 4(75):  51-55.

Another Rainforest Biting the Dust?


river
Kwa falls in Cross River state Rainforest, Nigeria Taken by Shiraz Chakera https://www.flickr.com/photos/shirazc/130088242/in/photolist-cuJGJ

Deforestation though necessary for industrialization, has a long-standing history of being severely detrimental to the environment. Deforestation, especially to that of tropical rainforest, plays a huge part in habitat loss, loss of biodiversity, and is a lead factor in global climate change. Sadly, rainforests in Wilberforce Island in Bayelsa State, Nigeria are no different.

The department of Geography and Environmental Management at the Niger Delta University located in Wilberforce island, conducted a survey around the reasoning behind the deforestation of the local area tropical rainforest. Using 125 questionnaires given out to the local inhabitants and satellite photos taken in 2002 and 2015 respectively, they came to several conclusions. They found that, through their questionnaire, that most of the destruction of the forest came in part to logging followed closely behind by farming. This was then backed up by the satellite images that revealed an increase of land usage due to agriculture from 10.71% in 2002 to 30.57% in 2015. Within just 13 years, land use from farming increased by 185.35%, mainly impart to the population growth that came from the construction of the Niger Delta University in 2000. Furthermore, this new designated farm land had to come from somewhere, and you probably guessed it by now, it came from land previously held by the rainforest.

No other research has been done into the deforestation of the forests on Wilberforce Island, and so it’s good that this study shed some light on what’s happening. Between 2002 and 2015 forest cover dropped by 30.02%, destroying millions of species habitats along with it. That rate is unheard of and much more outside of this study needs to be done to stop it.

My final personal note is I find it quite ironic and irritating that this survey was conducted by the Niger Delta University, the same establishment that was the underlying factor for the increased deforestation rates of the island in the first place. I hope they take their study to the next step and work to prevent the further logging and destruction of the forests.

For more information on the study see the full text at www.ajol.info or www.bioline.rg.br/ja.

Source

Bariweni, P.A., and Andrew, C.E., October 2017. Land use/Land Cover Changes and Causes of Deforestation in the Wilberforce Island Beyelsa State, Nigeria. J. Appl. Sci. Environ. Manage. 21