
An Unchanging Gap
In 1972 families making more than $17,760, those who constitute the most affluent fifth of the economic hierarchy earned 41.4% of the nation’s aggregate income. Meanwhile, those in the bottom fifth, making less than $5,612 annually, took in 5.4% of the total income. Those percentages have been little changed for a quarter-century.
The annual report by U.S. Council of Economic advisors detailed a larger gap between the rich and the poor in 1972 than in 1947. Graduated income tax made a gap between rich and poor because it did not redistribute wealth evenly, making inflation worse for the poor. Taxpayers in the higher brackets clearly have more opportunities to use legal write-offs than those with low income. Poverty levels increased in 1972 with the rise in the total cost of Social Security, Food Stamps and Medicare to $7.6 billion (Madrick 2011, 111). While these groups were helping those in need, the benefits also went to affluent people who had an income of over $25,000. The increase in inflation punished the poor and low-income families had to spend an average of 71% on necessities.
America Becomes less Equal
It’s no surprise that government spending has succeeded in redistributing money to the poor. The poorest third of the nation now receives more money from the federal government in transfer payments than it pays the government in taxes, and the poorest tenth gets back as much as three times its tax bill. Most of this largesse is the result of Great Society programs such as Medicaid and Medicare, food stamps and AFDC.
Joseph A. Pechman conducted a study in 1985 that disproved the idea that economic growth helps everyone and showed that the distribution of income has not changed within the past 20 years. Furthermore, if programs such as Medicaid and Medicare, had not been in place then the gap between rich and poor would have widened even further. However, at the time these programs did not help to lessen poverty in the United States, rather it stagnated the gap and kept it in one place. While the progressive tax system was an attempt to reduce the gaps, in 1966 it did not and the poorest tenth of the population paid federal, state, and local taxes at a rate of 17 % and the wealthiest tenth paid at a rate of 30% (Madrick 2011, 118). By 1980, these numbers rose for the poorest tenth from to 21% and declined to 27% for the richest tenth.
United States Census Bureau: Managers and Professionals

The data for Managers and Professionals from the consumer expenditures database shows the income of white-collar professionals from 1984-2016. The starting income after taxes in 1984 was $32,873 and as of January 2016 was $95,513. This graph shows a steady increase in wages for white-collar professionals with a dip from 2012-2013 of $14,000. This dataset accounts for manager positions, including architects, engineers, natural and social scientists, lawyers, teachers, and writers.
United States Census Bureau: Construction Workers and Mechanics
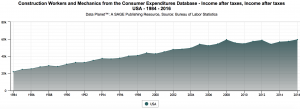
This data set shows the income after taxes for construction workers and mechanics from the consumer expenditures database from 1984-2016. The income in 1984 was $21,912, approximately $14,000 less than the white-collar income. The data shows growth over the period of thirty-two years and at 2016 the income level was $59,490. This figure compared the white-collar income in 2016 shows how the income gap has increased and the difference between the two parties is $41,000. As the wealthy have been gaining income through the years, the blue-collar workers have not had growth had such an increased pace. These jobs include production, craft, and repair workers, mechanics and construction trades occupations. These consumer expenses focused on frequently purchased items such as food, housekeeping supplies, and the payment of rent and utility bills.