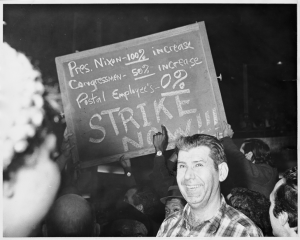
“The Great Postal Strike of 1970, Manhattan New York”, Walsh, John, photo from TIME magazine (March, 1970)

This photograph, taken by John Walsh from TIME magazine, is known for capturing just a snapshot of the massive week-long postal worker strike in March of 1970. The intended audience of this photograph from TIME was the American people, with the aim of the picture being to expose the harsh realities of low wages and high unemployment in the United States. This image captures angered postal workers striking in Manhattan, NY, showing that people in political power such as Nixon and members of Congress receiving increases in their wages at a time where wages were low for many. Postal workers and those working in labor, domestic, and agriculture were often forgotten about, and as unemployment and inflation both rose simultaneously, wages and job hiring fell significantly. With Congress finally passing a bill named “Postal Reorganization Act,” it had only raised wages 5%, which was less than the rate of inflation. For these postal workers, their priority was receiving an increase in wage, not only because they wanted more income but because their salaries were too low and unsustainable to live on for themselves and their families.
Economic Policy and the Great Stagflation, book by Alan S. Blinder (1979)

In 1979, Alan S. Blinder had written a book titled “Economic Policy and the Great Stagflation,” which covered the phenomenon deemed “Stagflation” that rippled throughout the 1960s through the 1970s. The purpose of its publication was to educate American citizens on the reasoning of high unemployment and high inflation that coincided. The start of the book covers the topic of high inflation in the U.S and why it was happening at the same time as high unemployment. The prevailing belief through Blinder’s book was that high levels of inflation were the result of an oil supply shock. With an oil supply shock, this rose the prices of gasoline in the U.S, which then drove the prices of everything else higher [1]. In other words, if the cost of a necessity in the economy, such as gas, increases significantly, then paying for gas means American citizens have to spend more for it. Businesses across the nation, having increased expenditures to pay for gas, raised prices to cope for the losses. With increases in the expenses for businesses, they laid-off workers as well to save money. Inflation is measured by the difference between the current year prices and the following years’ prices. In other words, crude oil in 1965 was roughly $24, and by 1980 it had skyrocketed to a high of $125[1]. From 1965-1980 there was a staggering 421% increase in the price of crude oil! From the 1960s to the 1980’s presidents, policymakers, and economists could not find an answer to the oil shock, let alone the high unemployment rate and high inflation.
President Reagan’s Address to the United States on the Economy (February 2, 1981)

On February 2nd, 1981, Ronald Reagan addresses the general public from the Oval Office with a message that the United States was facing its most serious recession since the Great Depression. In this photo, Reagan is discussing the current state of the economy through the example of holding a one-dollar bill. Reagan stated that a dollar made in 1960 is equivalent to only thirty cents in 1981. In his discussion, Reagan said that he would implement further tax cuts to citizens for the top bracket to combat the recession. Reagan also promised that he would cut corporate tax from 48% to 34% and stated to deregulate business industries, which makes it easier for business flourish[2]. With fewer regulations for business start-ups and by cutting taxes, this increased individuals’ wealth. Reagan was successful in lowering inflation for the nation; however, he was less successful in reducing the national debt. For Reagan, his priority was lowering the national inflation rate and then dropping the national debt, but because he had cut taxes significantly, the U.S national debt doubled by the end of his term.
Notes
- “Oil prices and outlook,” U.S Energy Information Administration, last modified July 2, 2019, https://www.eia.gov/energyexplained/oil-and-petroleum-products/prices-and-outlook.php.
- “An Analysis of the Reagan Tax Cuts and the Democratic Alternative,” The Heritage Foundation, last modified July 13, 1981, https://www.heritage.org/taxes/report/analysis-the-reagan-tax-cuts-and-the-democratic-alternative.
