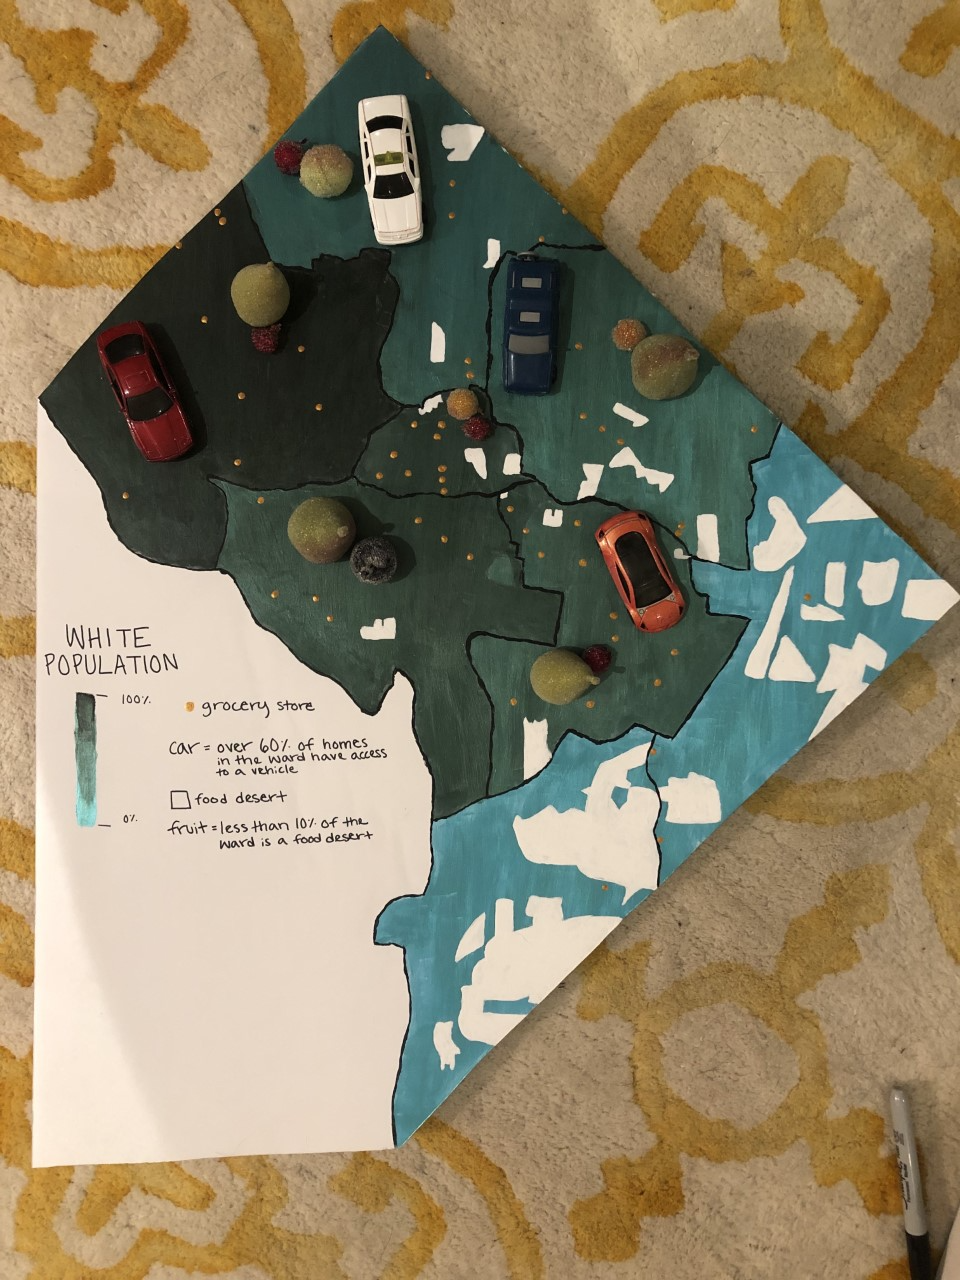
This project emphasizes the injustice present in food systems in our society by analyzing food deserts. Food deserts are defined by an area that is further than half a mile from a grocery store, over forty percent of homes in the area do not have vehicle access, and the average income is less than 185 percent of the federal poverty level (DC Policy Center, 2017). In Washington DC, eleven percent of the city’s neighborhoods fall under these criteria, classifying them as food deserts (Smith, 2017). The city is broken down into eight wards, in which resources and accessibility to fresh food vary greatly.
Unfortunately for DC, grocery stores, vehicles access, and income do not seem to be the only factors involved in the making of food deserts. The presence of these deserts perfectly overlaps with areas containing low populations of white residents. In Ward 3, there are zero neighborhoods that qualify as food deserts and the population of white residents in the ward ranks in at the highest in the city at over 81% (DC Health Matters, 2020). However, not all of the wards in DC are the same as Ward 3. Of the neighborhoods that qualify as food deserts, 82% of them are in Wards 7 and 8 (Smith, 2017), both of which have populations of white residents that are below five percent each (DC Health Matters, 2020). The DC wards with high minority populations are then being disproportionately impacted by food deserts in the city and getting locked into a cycle of poor nutrition due this environmental bad being embedded into our society. The U.S. Department of Agriculture estimates that groceries in food deserts are then sold for ten percent more than they would be sold in suburban markets (Hirsch, 2007), making it that much harder for the residents of these neighborhoods to break the cycle and eat healthier. The difficulty involved in eating a healthy diet in Wards 7 and 8 can be directly tied to obesity rates, as obesity in these wards have reached over 72% of residents, the highest rate in the city (DC Health). Food deserts are posing major health risks to the lives of residents in Wards 7 and 8 but sparing the lives of white residents in other parts of the city.
The location of food deserts is disproportionately impacting minority residents and depriving them of a basic human right: equal access to fresh food. When considering the food oases in the majority white wards, the unjust sustainability is unveiled. The disparities in our food system vividly represent an unjust sustainability in which one social group (white populations) are being favored over another (minority populations), proving that sustainability can only be achieved once societal inequalities are solved first.

pikturne
May 1, 2020 — 5:41 pm
Really interesting topic! I wonder how healthcare inequalities play even further into this unjustsustainability. If these communities had access to free and comprehensive healthcare would there still be the same issues? I’ve read that insulin prices have continued to rise – I wonder if this is exacerbating the issue as well.
Kathryn
May 1, 2020 — 5:43 pm
Your map/visual representation is really powerful and clearly shows not only food deserts but also racial and ethnic segregation. I would be really interested to know the history of segregation and redlining in this area.
palaciom
May 1, 2020 — 5:43 pm
I was really taken away by the fact that groceries are so sold for 10% more in areas that are considered food deserts which only continues to prove the inequitable access to a healthier lifestyle.
FS
May 1, 2020 — 5:46 pm
Your visual makes it easy to understand the issue. May be a silly question but when you speak to the fact of vehicle accessibility, does it include public transportation?
Anna
May 1, 2020 — 5:49 pm
Thanks so much! The vehicle accessibility only accounts for homes that have individual access to a vehicle such as a car or motorcycle.
gontareg
May 1, 2020 — 5:48 pm
Wow!! I love your visual. This is a really important topic, especially because food deserts can impact people’s lives in so many different ways. Like Kathryn, I would be interested to see if there is redlining correlated with this as well.
Hiba
May 1, 2020 — 6:00 pm
Quite shocking when you investigate parameters behind the distribution of food deserts in the D.C area and find that 82% of them are in the specific wards where white populations constitute less than 5% of the population. Great visual to go with the project!
ketchumt
May 1, 2020 — 6:03 pm
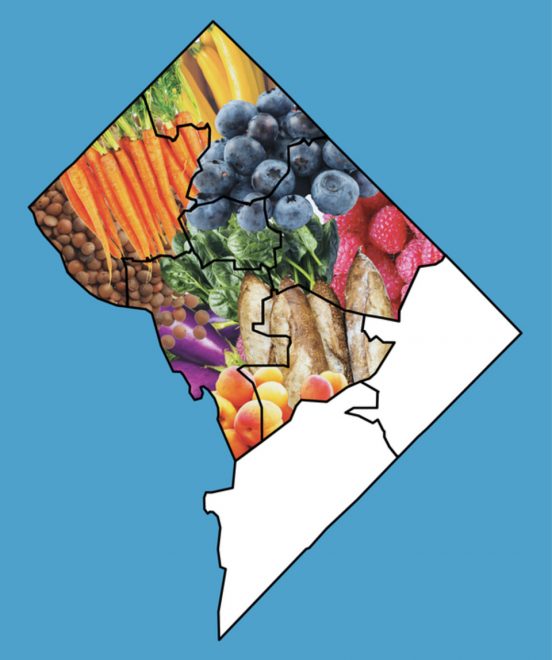
I really like both of the visuals as it really demonstrates the problem that you have been looking into!
gamzan
May 1, 2020 — 6:08 pm
I think it’s important that you touched on economic and transportational flexibility when relating to food sources, it’s a good remaindering that almost everything we discuss in class is connected in someway.
RM
May 1, 2020 — 6:10 pm
Wow your artwork and use of food to demonstrate your point definitely works. Not only food but access to fresh fruit and produce is super inmportant and upsetting to think that some people do not have reasonable access to those things. Very good explanation and creativity.
Maggie Douglas
May 1, 2020 — 6:16 pm
Powerful! I found it really interesting that you represented % white from light to dark in the way that you did – to me it brought racial privilege to the forefront – what was your thinking behind that choice?
brownemm
May 1, 2020 — 6:19 pm
I love the materials you used! Such a cool way to demonstrate this critical issue. I’d be interested to see if DC has a different capacity to rectify this issue since they don’t have an access to a state government and if redlining in DC has been more or less severely redlined than other major U.S. cities.
Allison Acevedo
May 1, 2020 — 6:27 pm
The numbers relating to food access are jarring and show clear injustices. The research gets your point across. Did you find any correlation between food deserts and hunger?