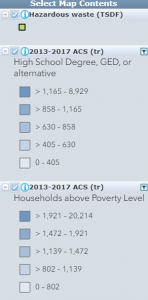
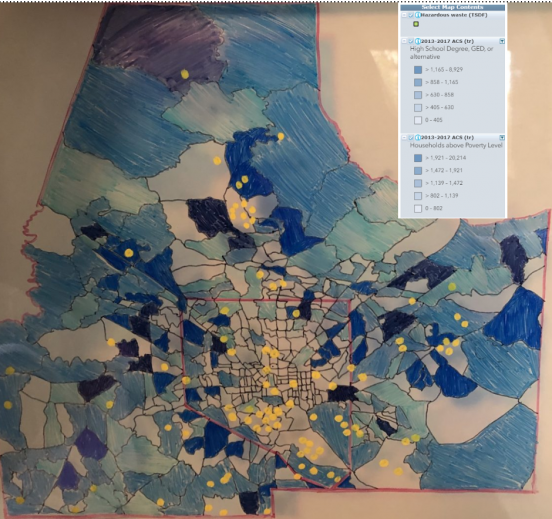
I looked at Baltimore city and its surrounding Baltimore county to see where hazardous waste sites are located. Hazardous waste encapsulates many types of pollutants, but particulate matter is of great concern here. Particulate matter (PM) is small compounds of particulates which are caused by electricity generation, waste disposal, industrial sites, and more (National Research Council 2010). It causes many adverse health effects and is encountered in extremely high concentrations in and around hazardous waste sites. These sites are located almost exclusively in neighborhoods with high concentrations of minority households living below the poverty line; households which already struggle to receive affordable health care and access to medications that are needed to treat illnesses (EPA 2019). These issues are then further compounded by an incredibly high exposure to particulate matter which causes serious health impacts as a result of both short and long-term exposure including lower respiratory issues, cardiovascular disease, decreased lung function, chronic obstructive pulmonary disease, lung cancer, and decreased life expectancy (Puett, et al. 2014). Baltimore particulate matter maps reveal concentration of these pollutants in impoverished neighborhoods with high minority concentrations (EPA 2019). This relates directly to the theory of unjust sustainability, the inequitable relationship between demographics and their environments. Race, income, and housing affect how people interact with their environment and disadvantaged household often experience a disproportionate amount of environmental bads. In Baltimore, there is evidence that poor minority households are at a disproportionate environmental health risk because of hazardous waste sites surrounding their households, making hazardous waste sites in Baltimore an unjust sustainability. This visual shows these patterns through households below the poverty line and people who have high school diploma, GED, or an equivalent; I used recycled plastic to create this visual based on EJ mapper demographic maps.


April 30, 2020


gontareg
May 1, 2020 — 5:45 pm
This is super interesting! Your exhibit note is really clear and packed with lots of information. My only question is, do you know what kind of hazardous waste is deposited at these sites (besides the concern about PM)? I wonder if that can have implications for cancer risk in the inner-Baltimore community.
bromleyd
May 1, 2020 — 5:54 pm
All of the sites also track 8-hour ozone, lead, carbon monoxide, nitrogen dioxide, and sulfur dioxide concentrations in the area in addition to particulate matter within a 3 mile circumference of the marked area. There are also indexes included in the reports for each site that shows waste water discharge proximity, toxic air cancer risk, respiratory hazard, traffic proximity, and superfund proximity.
bascolot
May 1, 2020 — 6:02 pm
This is a great research project and visual presentation. Firstly, I love your visual, it definitively shows that you put a lot of time on the details of the map and pointing the hazardous waste. I also really like how you introduced the topic and information.
Best.
Claudia
May 1, 2020 — 6:12 pm
Your exhibit note is super well researched and easy to follow. You have made such a complex series of injustice easy to absorb! Were you surprised by any of your findings? I also did a project on the disproportionate siting of hazardous waste and found certain intriguing details once I started digging.
bromleyd
May 1, 2020 — 6:16 pm
Even though I focused on particulate matter, I was really surprised how many hazards are at each site and how many there were all over the city and county. I am glad the EPA tracks these sites, but it is worrisome how many can be packed into such small areas.
Maggie Douglas
May 1, 2020 — 6:22 pm
Very interesting exhibit! Have you seen the emerging research suggesting that PM exposure worsens outcomes with covid-19? How do you think these different hazards will interact to affect the people of Baltimore?
bromleyd
May 1, 2020 — 6:30 pm
I think there is a big correlation between PM (and other toxic chemicals in sites like these) and death rates in Baltimore related to the pandemic. Black residents of Baltimore are dying at over double the rate of white residents and we already know that the existence of pre-existing conditions causes the mortality rate to rise in covid-19. Specifically incidence of respiratory disease and coronary issues, which both are the most prevalent effect of exposure to PM.
Sooik
May 2, 2020 — 3:39 am
Very clear visual and note! It shows that the households above the poverty level are located in suburban areas. It is really interesting as I also found that low-income households tend to cluster in the downtown area. I was wondering if you were able to find how different sizes of particulate matter (PM2.5 and PM10) affected each community. I heard that while they are all known to cause some health complications, PM2.5 is way more harmful than PM10 given that its size is small enough to get into our respiratory system more easily. It would be interesting to see how the composition of particulate matter affects the health outcome of those areas.