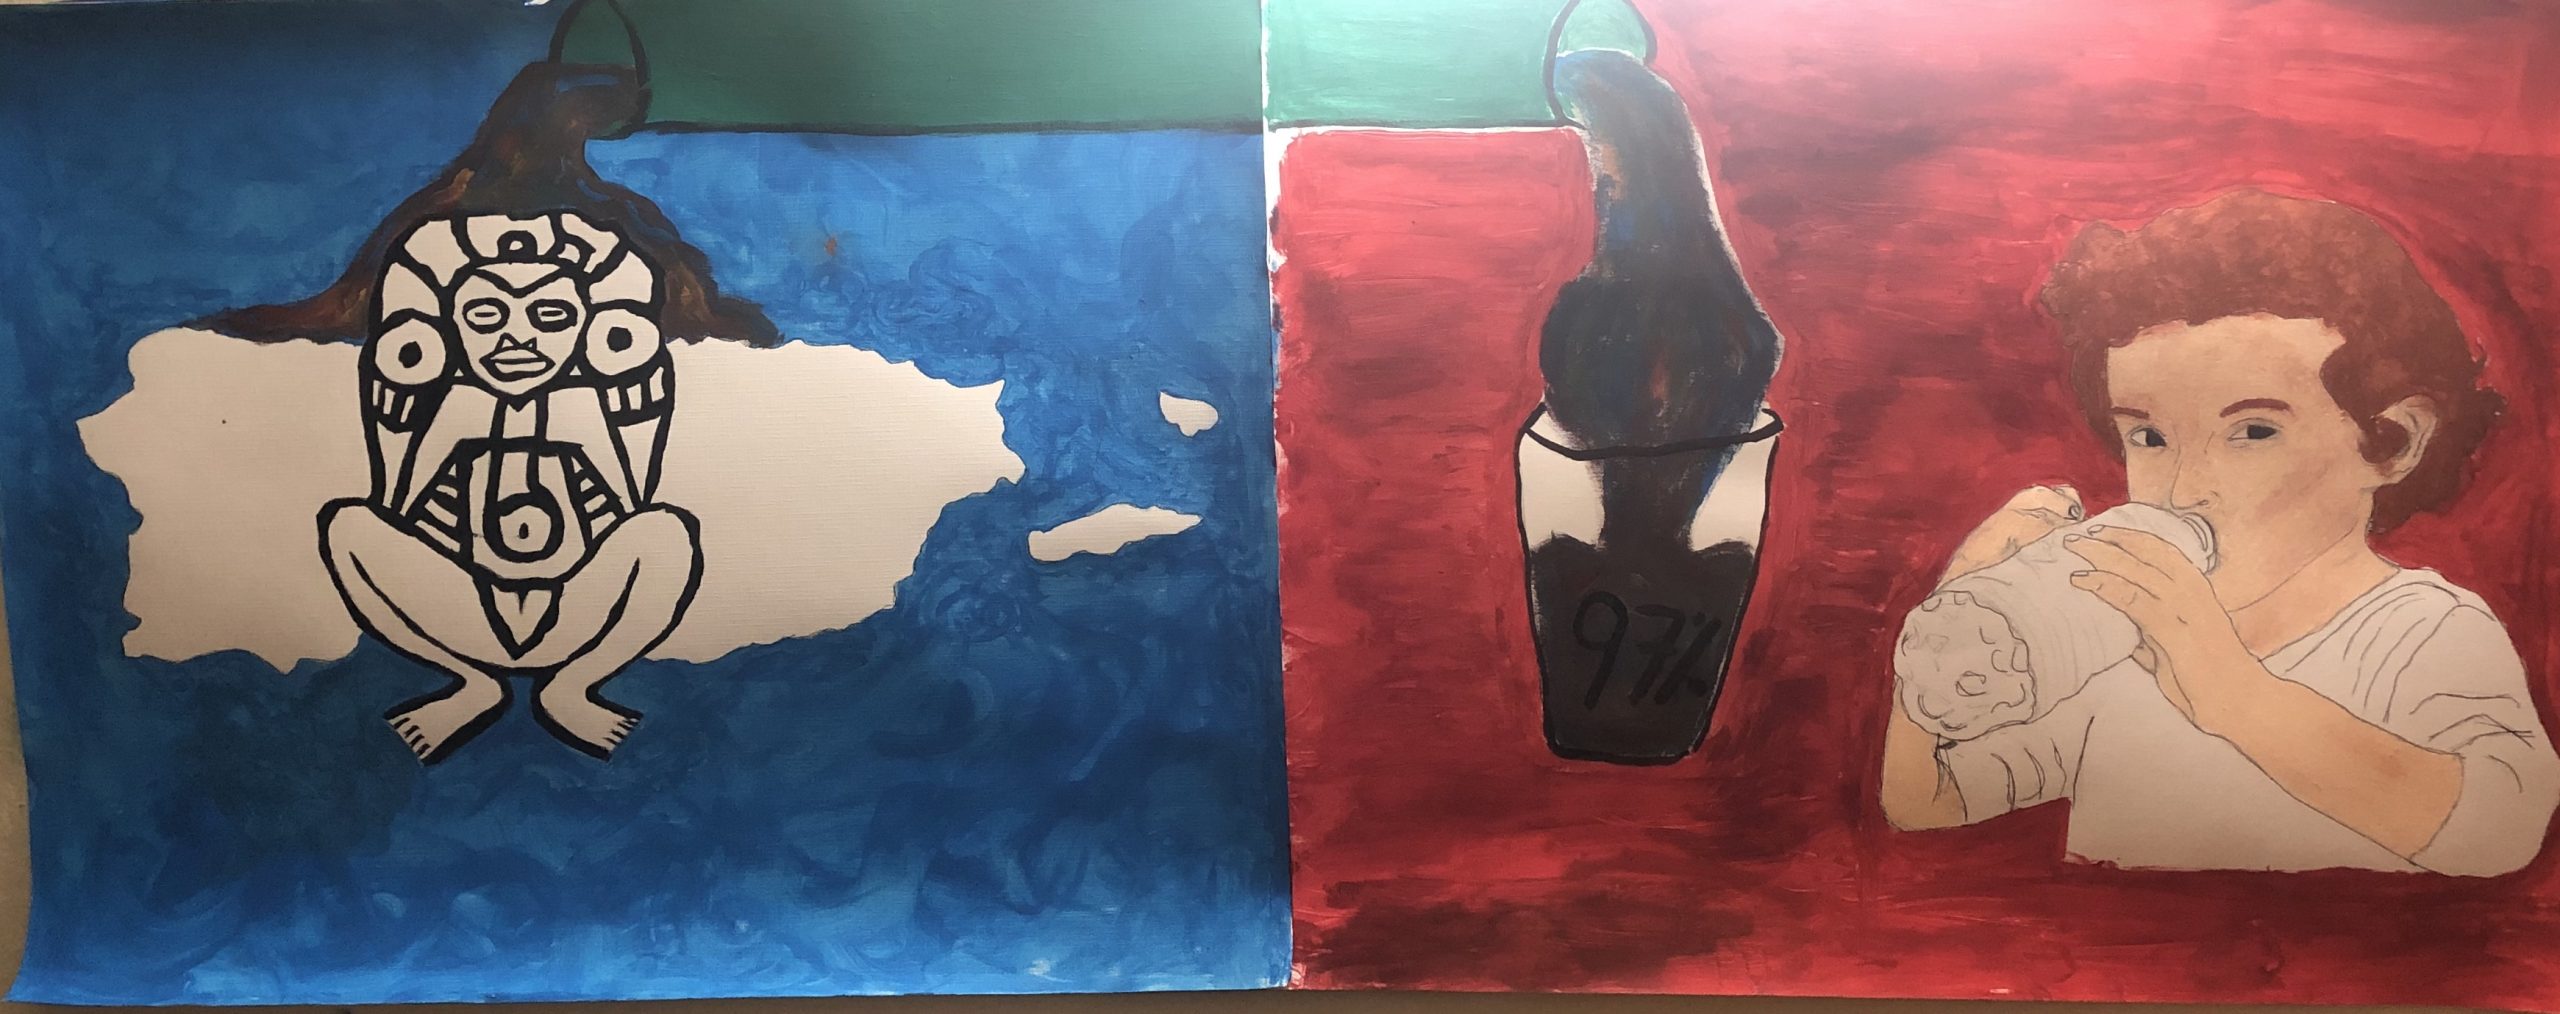
 Puerto Rico is a U.S. Commonwealth comprised of 143 islands, cays, islets, and atolls. Of the 143 locations, only 3 islands are inhabited: the mainland (which is often just referenced as Puerto Rico), Culebra, and Vieques. In order to properly analyze, the mainland will serve as the focal point for an examination of environmental and social injustices. Puerto Rico is a racially mixed but ethnically homogenous territory, with the majority of the commonwealth below the poverty level. Education levels slightly vary, however, can be understood as consistent throughout the island’s 78 municipalities. Water dischargers, locations in which both treated and untreated wastewater is released into local water sources, are found across the island with no specific clustering. Because of the island’s homogeneity in poverty, education, and minority status, I will examine not the specific location of the water dischargers but the quantity in which they exist on the island and their effects on both environmental and social circumstances. Despite EPA regulations on how water discharging should occur, Puerto Rico’s drinking water has failed to be properly treated nor evaluated, causing 97- 99.5% of the drinking water to be contaminated (NRDC). Current contamination includes toxins such as heavy metals, bacterial pathogens, and synthetic and volatile organic contaminants (NRDC). Toxin presence in local waterways has harmed aquatic life and cause public health issues, ranging from developmental issues, kidney and liver damage, and various cancers. While no one specific area of the island is disproportionately impacted by wastewater, due to the homogenous ethnic minority status and poverty level of Puerto Rico, toxin release from discharge sites can be understood as an unjust sustainability as the United States fails to equally enforce EPA regulations that ensure potable water to the same level upheld in the states.
Please click here to see the infographic in better detail: https://my.visme.co/view/g7zjqxzx-environmental-injustice-in-puerto-rico 


Ben
May 1, 2020 — 4:16 pm
excellent presentation! Are there estimates of the costs to ‘fix’ PR’s water situation, and also estimates of the financial cost to PR of having so much water contamination?
meltmarr
May 1, 2020 — 5:35 pm
I love you artistic style and the art you chose to repersent the lack of fresh water for 97% of puerto rican residents. Do you know if Hurricane Maria exacerbated the contamination of Puerto Rico’s water supply?
A.R.
May 1, 2020 — 5:57 pm
Thank you! Yes, Hurricane Maria did exacerbate the contamination of Puerto Rico’s water supply greatly. Due to the hurricane damaging the already limited electrical grid, outages caused disruption to not only water delivery but the ability of water treatment plants to function. According to the EPA, over 1/3 of treatment plants were unable to run after the hurricane. Due to this, there was a huge outbreak of leptospirosis across the island. However, this percentage of Puerto Ricans receiving contaminated drinking water has been consistent from years prior to the hurricane: in 2015, it was noted that 99.5% of Puerto Ricans received contaminated drinking water.
Kathryn
May 1, 2020 — 5:37 pm
Your visuals are a really powerful way to tie this issue together. I’m really shocked to see just how prevalent water contamination is and to see it in a map is really striking! I was also shocked to learn that in 2017 97% of Puerto Ricans received and drank contaminated water. Clearly this issue is a huge one and must be addressed. Thank you for bringing it to our attention!
ketchumt
May 1, 2020 — 5:37 pm
These two pictures are so well done and really add a great extra layer in the presentation of your environmental bad!
gamzan
May 1, 2020 — 5:41 pm
It’s powerful to see how many people are affected by this issue in Puerto Rico everyday, while many don’t even know it’s happening. I think you choose a very important topic and the picture is very creative!
galbanv
May 1, 2020 — 5:44 pm
I’ve been looking forward to seeing your blog post! I was absolutely fascinated (and very shocked) during your snap talk. The statistics and situations you explained were great examples of large-scale social and environmental injustices. It’s really surprising to me that injustices of this scale can exist within the United States. I’m assuming there are social movements to try to right these wrongs. Has any serious progress been made recently?
I loved your visuals, as well! Your artistic skills are impressive. I like how you incorporated an indigenous goddess into your work.
A.R.
May 1, 2020 — 6:27 pm
Thank you so much!
There are many communities based/ grass-roots organizations trying to combat inequalities across the island, however, I am unsure of how much progress has been made due to the chaotic political and economic state of the island. Puerto Rico in the past couple of years has had several natural disasters that led to the exacerbation of many existing humanitarian crises (such as access to clean water). Many know of Hurricane Maria doing so, but more recently Puerto Rico had an insane amount of earthquakes – 43 being marked “significant”. These earthquakes destroyed almost all progress communities made after Maria and exposed the government’s insufficient assistance. Millions of water bottles, amongst other relief materials that were never distributed after the natural disasters were discovered both times. Thus, many grassroots organizations are combatting the faulty local government as well as advocating for the liberation of Puerto Rico from a U.S. territory to an independent country. This is seen as the main solution to almost all Puerto Rico’s issues as the elimination of U.S. rule and Puerto Rico’s government corruption would also eliminate the grand economic strain the island has ($74 billion debt to the U.S.).
Here are some links that describe the issues in more depth:
https://www.nytimes.com/2020/03/01/us/puerto-rico-earthquakes-fema.html
https://www.cbsnews.com/news/puerto-rico-water-bottles-possibly-millions-for-hurricane-maria-victims-sitting-on-tarmac/
https://www.miamiherald.com/news/nation-world/world/americas/article239469148.html
RM
May 1, 2020 — 5:45 pm
Your infographic, exhibit note, and artwork work together to create a powerful explanation of your environmental bad and its effects. Its shocking that this contamination is found so concentrated all over Puerto Rico and its an inequality not with the country, but the entire country is feeling the inequities of their right to clean water. Really captivating and informative post!
Jorden
May 1, 2020 — 5:46 pm
Thank you for creating such a thoughtful presentation! You’ve created a compelling visual story. I wonder how an apparent lack of regulation/enforcement has impacted the growth of manufacturing in PR. Are the water dischargers predominantly from industry? If so, what kind?
A.R.
May 1, 2020 — 6:46 pm
Thank you!
I am not too knowledgable about manufacturing in Puerto Rico, but based on a quick search, I discovered that “Puerto Rico manufacturing output for 2018 was $47.83B, a 5.13% decline from 2017.” In 2017, “Puerto Rico manufacturing output … was $50.42B, a 0.24% decline from 2016” (World Bank Data). However, the two years prior to 2017 saw increases in manufacturing outputs. When looking at data from 1960-2018, it seems that there has been a steady increase in manufacturing outputs until 2017. Contaminated water has been an issue in Puerto Rico way before 2015, so I am unsure if there is any correlation.
Puerto Rico Aqueduct and Sewer Authority (PRASA) is responsible for providing 97% of drinking water as well as sewer service to at least 50% of the island, but as to how many are industry owned and which specific industry I am unsure of. I will continue researching to see if I can find that information.
Source:
https://www.macrotrends.net/countries/PRI/puerto-rico/manufacturing-output
Anna
May 1, 2020 — 5:55 pm
Wow, this is an amazingly well done project. I love how you incorporated both an artistic interpretation and an infographic to support it with data. After seeing that 97% of Puerto Ricans were exposed to contaminated water, it makes me wonder what factors went in to the remaining 3% not being exposed?
bascolot
May 1, 2020 — 5:56 pm
This is such a great project, well-developed, informative, and super coherent. I love your visual, I am really sorry I was not in class to be able to see it being presented. Your infographic is great, I love how you formatted the data and structured the images. Also, your background information of Puerto Rico is great, super complete. It gives the audience a great understanding of the contextualization of this issue.
Best.
Kristin
May 1, 2020 — 6:01 pm
Great visualizations and I really enjoy the way you communicate data in the infographic for a broad audience. Curious for action items or ways forward being proposed? Could we address these disparities with a scientific solution? A political solution? Also curious about the comparisons to the states within the US – how is “water contamination” determined? Is it one specific analyte? I’m curious if we compare one of the other items on your infographic like synthetic organics, which is not currently well regulated by the EPA within or outside the states, if there would be a similar amount of exposure?
Allison Acevedo
May 1, 2020 — 6:22 pm
This is a great project. I am shocked to hear about the 97% water contamination rate and cannot believe these stats are not addressed as much as they should be in public discourse and policy spaces. I was also moved by the visuals, which displayed the critical place water holds in the culture and tradition as well as representing the current public health and environmental challenges.