On July 9th, the ALLARM team took a trip to Otsego County in New York for a long-awaited data interpretation workshop for the Otsego County Conservation Association (OCCA). During this two-part event, we gave an initial presentation on water quality influencers, state standards and policy, statistics, and a primer on how to read a graph, to give the volunteers context that would help them interpret the data they had been working hard to collect. We then facilitated a volunteer-driven discussion about data analysis that led to some pretty interesting conversations and many valuable takeaways.
Kristin:
During our presentation, I talked about Otsego County’s geology and how it might influence the water quality and data collected from its streams. Because the county itself is largely made up of shale rock with some strips of limestone in the north, my preparation for this event involved a lot of research on the traits of calcareous (limestone) and shale streams, how they specifically impact things like water temperature and conductivity, and how those effects can be found in the data collected by volunteers. I was excited to share these details with the workshop attendees and supply them with tools to uncover the stories behind their data, especially since they were so engaged and enthusiastic about their work. This enthusiasm carried over into the conversations that I had with some of the volunteers about their streams, so being able to talk with them about their different sites and monitoring experiences was definitely a highlight of the event for me.
Ayako:
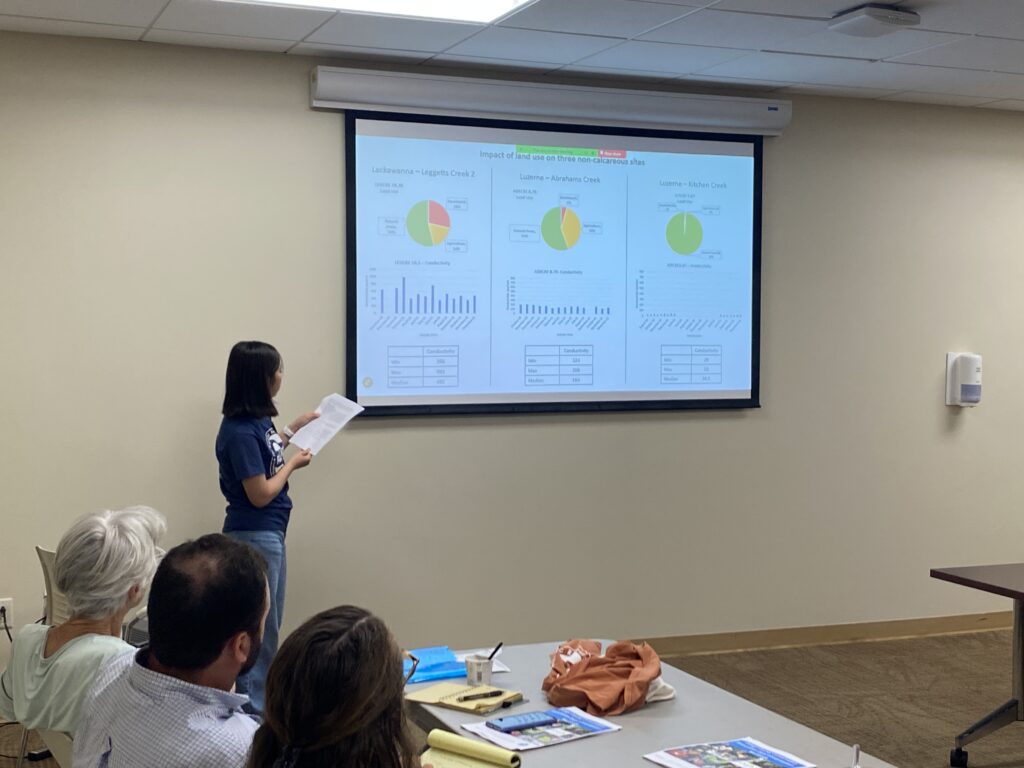
This workshop was one the events I am most proud of from this summer. I spent a lot of time preparing for the presentation by watching previous data interpretation presentations, updating the presentation slides for OCCA, and researching climate change impacts and land use in upstate New York. I also had a chance to help finalize the data packets by putting graphs and tables together for each site.
During the presentation, I introduced natural and human-induced water quality influencers and discussed their effects on the parameters that the volunteers are monitoring. The biggest takeaway from this data interpretation workshop was how eager attendees were t0 apply information we gave them to make a connection and to understand their data better. I learned a lot from volunteers who know more about their areas and streams than us. It was a great opportunity to gain new skills such as Canva and Excel in the preparation and to get better at public speaking.
David:
The lead up to the workshop was a flurry of activity. I was busy preparing informational packets for all the volunteers that summarized the data that they had been collecting since 2017. The actual event felt like it came quite quickly despite the length of the drive. I was incredibly impressed by how engaged and enthusiastic all the volunteers were. Overall, my favorite element of the workshop was the second half where we discussed the data stories with volunteers and tried to puzzle out the “why” behind the data. Almost everyone contributed an observation or question, many of which had never occurred to me before. It was a fantastic reminder that place-based knowledge is still underestimated even when you’re looking out for it.
Overall, the workshop was a huge success! It was exciting to see volunteers working together to interpret their findings and give each other insight based on their experiences. We are looking forward to seeing what these volunteers accomplish in the future!