Which light environment should we test for nitrate in?
Nitrate is an important indicator of stream health. At ALLARM, the LaMotte Nitrate-Nitrogen Tablet Kit is used to measure the concentration (mg/L) of nitrate-nitrogen in water. Nitrate- nitrogen (NO3-N) measures the amount of nitrogen in the nitrate ion (NO3-) (1). Nitrate ions are a major form of dissolved nitrogen in water due to high solubility (2). Although nitrate is a necessary nutrient for plants, too much nitrogen in water can cause problems such as overgrowth of SAVs (submerged aquatic vegetation), plant die-off and plant decomposition that can result in a reduction in dissolved oxygen. These make it harder for organisms to survive in the stream. With the LaMotte kit, a color comparison of the samples and concentration scale in the kit is used to determine the nitrate-nitrogen value (Photo 1).
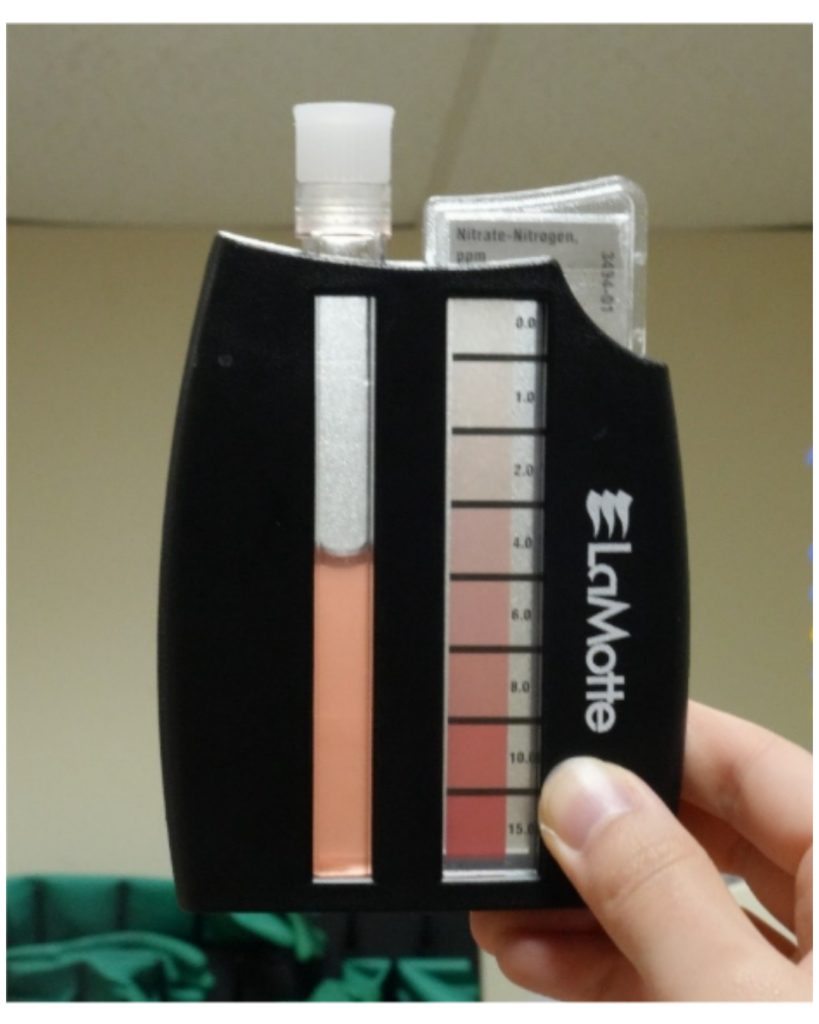
Photo 1: Color comparison with LaMotte Nitrate-Nitrogen kit.
The LaMotte Nitrate-Nitrogen Table Kit is an easy kit that makes nitrate testing more accessible. However, since it uses a color scale, it is a very subjective way of determining concentration. Each person perceives the color differently when comparing the sample color and the color on the slide, possibly leading to the inaccurate value. Additionally, the color of the sample and the slide look different under different light environments, and certain concentration ranges on the bar are lighter and therefore more challenging to determine the value. In the past, when comparing nitrate values with the HACH TNT 835 method, which is a more high-resolution spectrophotometer method, we found values measured with TNT were an average of 1.2 mg/L lower than the kit. This example highlights the challenges of using the kit. This experiment was designed to understand how different light environments affect nitrate readings and find the best light environment to minimize error in reading the values.
Methods
Table 1: Different light environments used in this experiment.
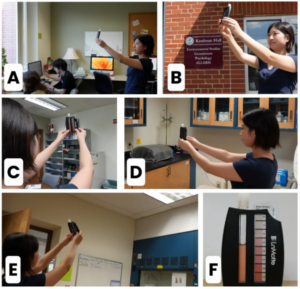
A. In front of the office window.
B. Natural light outside.
C. In the middle of the office (Access to natural light but not facing it).
D. Inside the lab room (No access to natural light, access to artificial light but not facing it directly).
E. Artificial Lighting (Facing directly to artificial light in the lab).
F. White Paper / Wall (In the lab, on the table, white paper on background).
Table 2: Weather condition during the experiment.
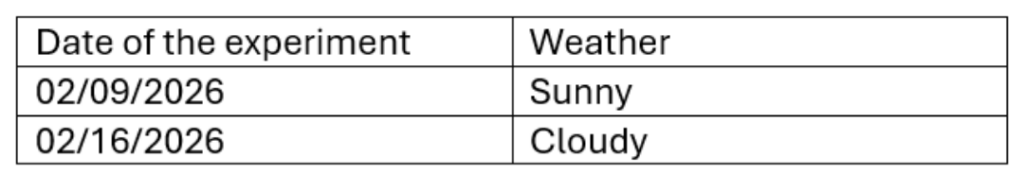
Table 3: Nitrate standards used in the experiment.
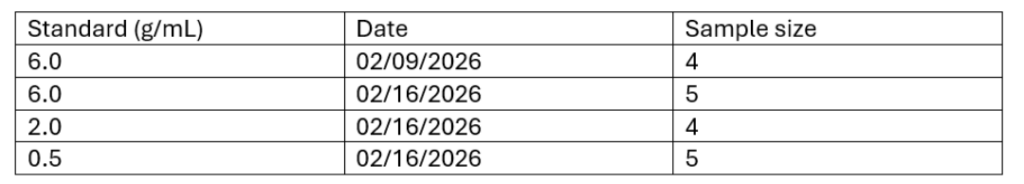
In this experiment, I followed the same protocol that our volunteer monitors use for nitrate testing using the LaMotte Nitrate-Nitrogen Tablet Kit. Three different concentration standards were used to compare the measured value and actual value (Table 3). Five ALLARM members including full-time staff and student watershed coordinators were involved in data collection. During each trial, the values were measured on the same day, at around the same time, and at the same locations. To determine the accuracy of each light environment, I compared the value measured with the kit to the value of the standard used in the experiment.
After collecting data, I analyzed the difference between the known standards values and the values read from the kit and considered tendency of reading colors in each environment. I categorized them into four datasets that used different variables and visualized them on Excel. The first dataset assessed different concentration standards, the second weather, the third different light environments, and the fourth individual testers.
Results
Table 4: Three different concentration standards used in the experiment.
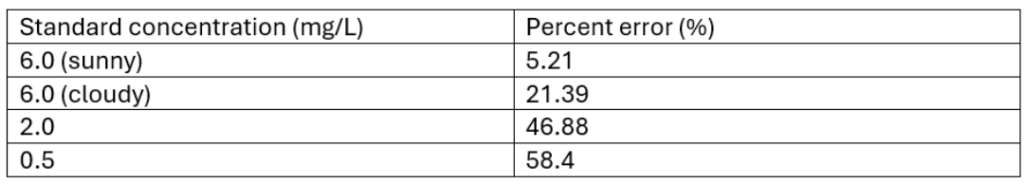
Higher concentration standards such as 6.0 mg/L had a lower percent error of 5.21% and 21.39% compared to the lower concentration standards (0.5 and 2.0 mg/L) which had percent errors of 46.88% and 58.4%, respectively (Table 4). For 0.5 mg/L, the average value was lower than the actual value.
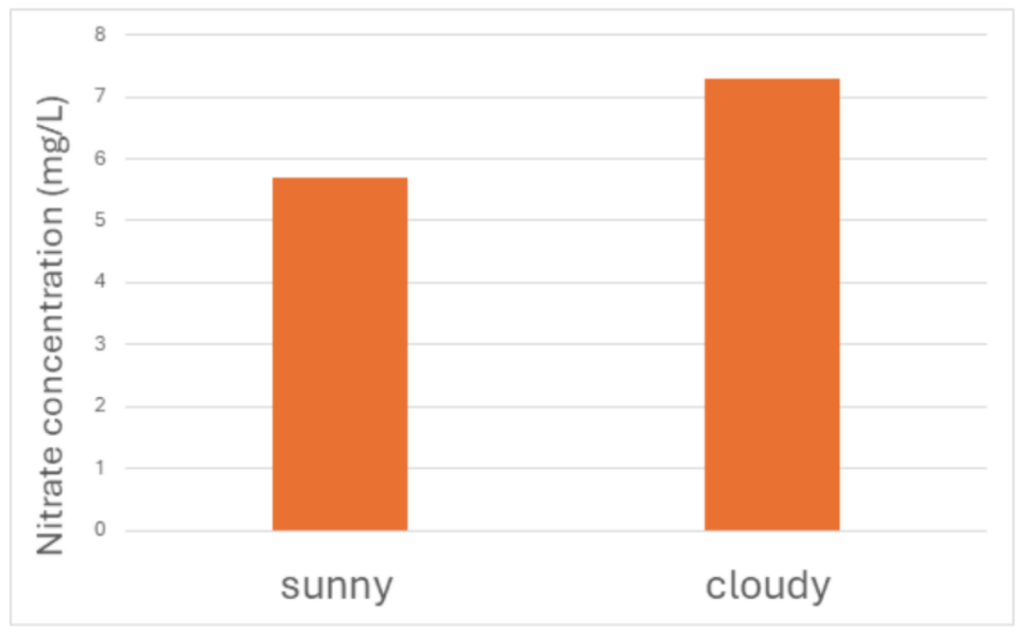
Figure 1: The difference in average value under different weather conditions (standard 6.0 mg/L).
When using the same standard under different weather conditions (sunny and cloudy), the average value differed by about 1.6 mg/L. The values tended to be read higher by approximately 1.1 mg/L on average on cloudy days. When testing nitrate values outside on a cloudy day, the average value was 1.6 mg/L higher than the actual value. In contrast, the results were close to the actual value when testing outside on a sunny day, being lower by only 0.4 mg/L on average (Figure 1).
Table 5: The percent error of different light environments and weather conditions.
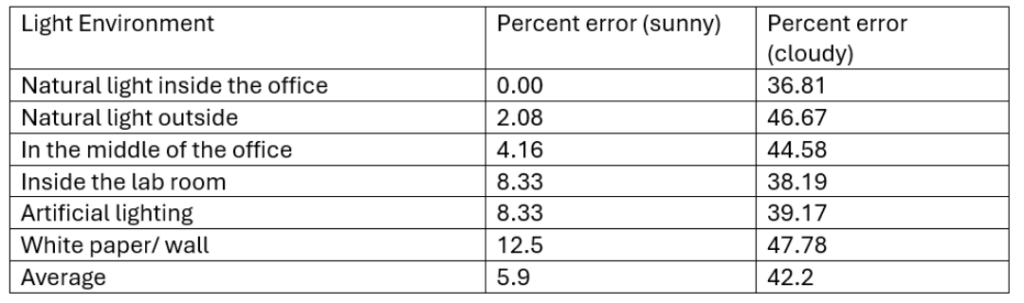
Reading standards on a sunny day in front of the office window had the lowest percent error, while reading inside using white paper has the highest percent error. Overall, though, percent error was low. On a cloudy day, in front of the office window, inside the lab room and facing artificial lighting have the lowest percent error for that weather condition but are still much higher percent errors than measurements on a sunny day. On average, the percent error on the sunny day was 5.9% while percent error on cloudy day was 42.2%.
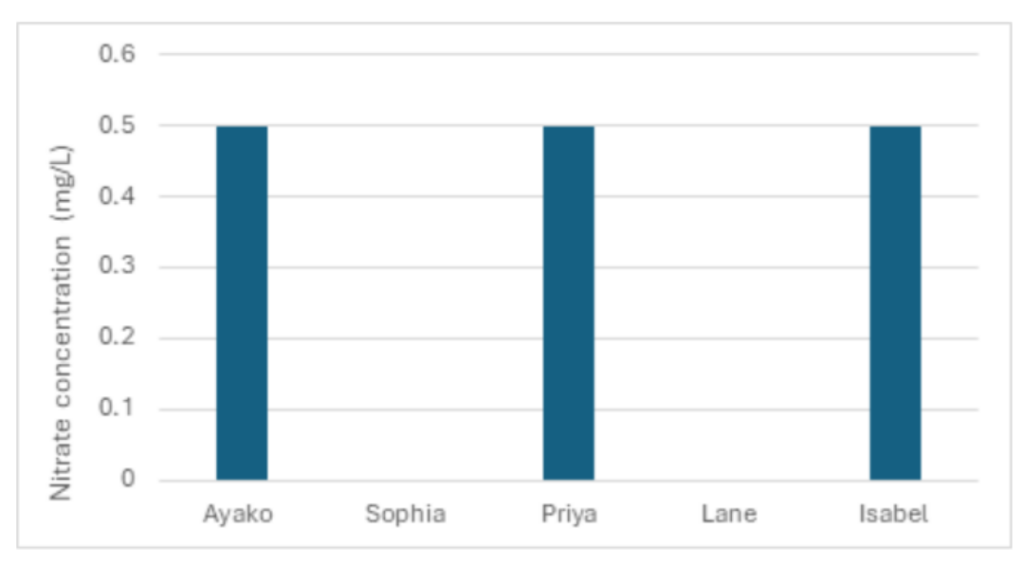
Figure 2: Results from testing standard 0.5 mg/L outside with light passing through the kit.
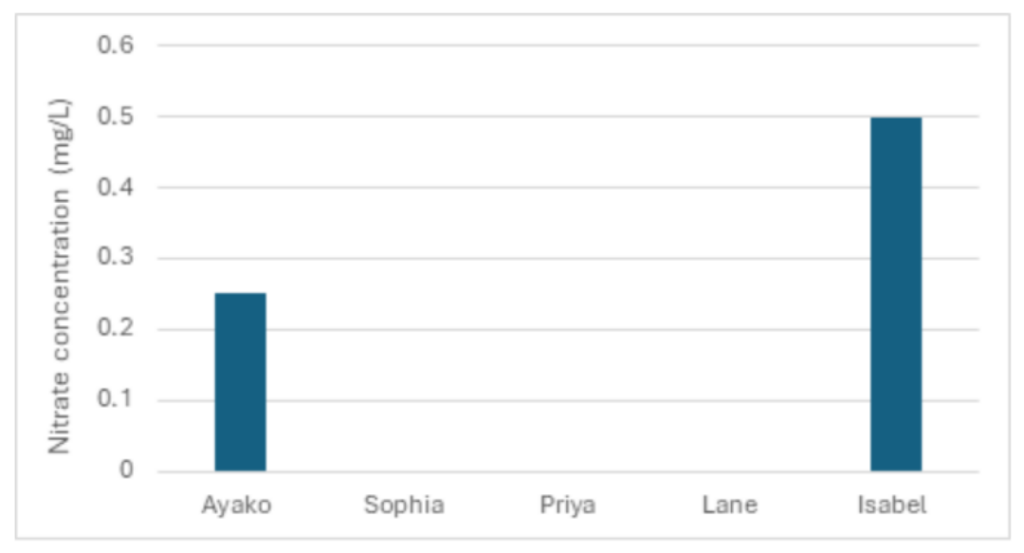
Figure 3: Results from testing standard 0.5 mg/L inside without light passing through the kit.
The same standard (0.5 mg/L) was tested on the same day but in two different light environments where the first environment had a lot of light coming through the kit and the second environment did not have enough lighting. Outside where there was more natural light, three out of five testers read the standard accurate value (Figure 2). When the kit was performed inside where there was no direct light passing through, only one tester read the standard value, and the color was perceived lighter (Figure 3). Photo 2 shows the clear difference in the color of the same standard under different light environments. When the test was performed outside, the average value was 0.2 mg/L lower than the actual when it was performed inside and in front of white paper, the average value was 0.35 mg/L lower.
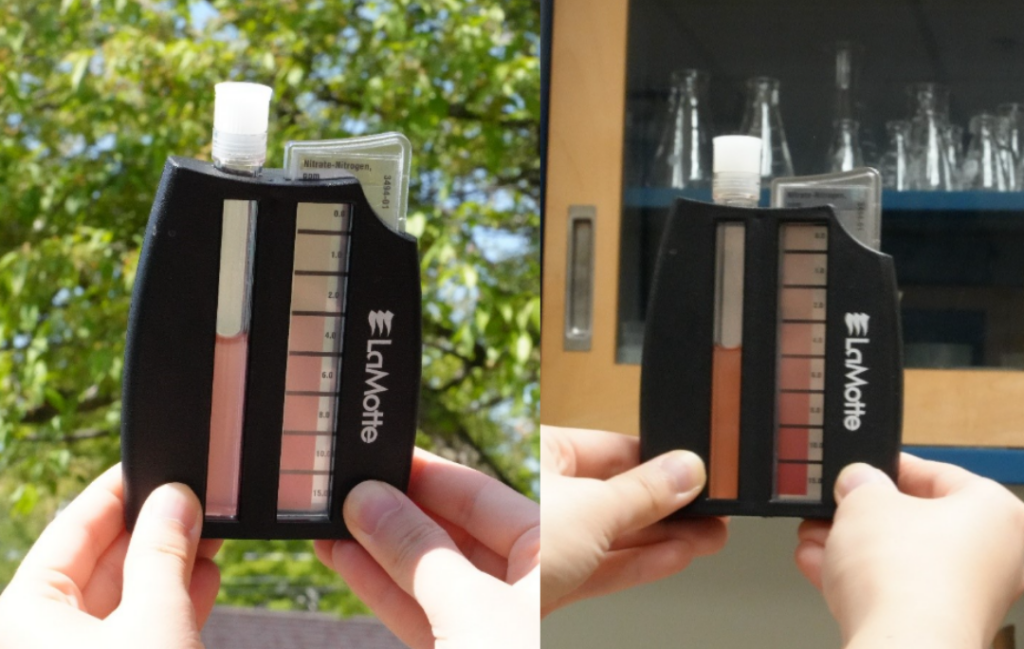
Photo 2: The color difference of the same standard in different light environments.
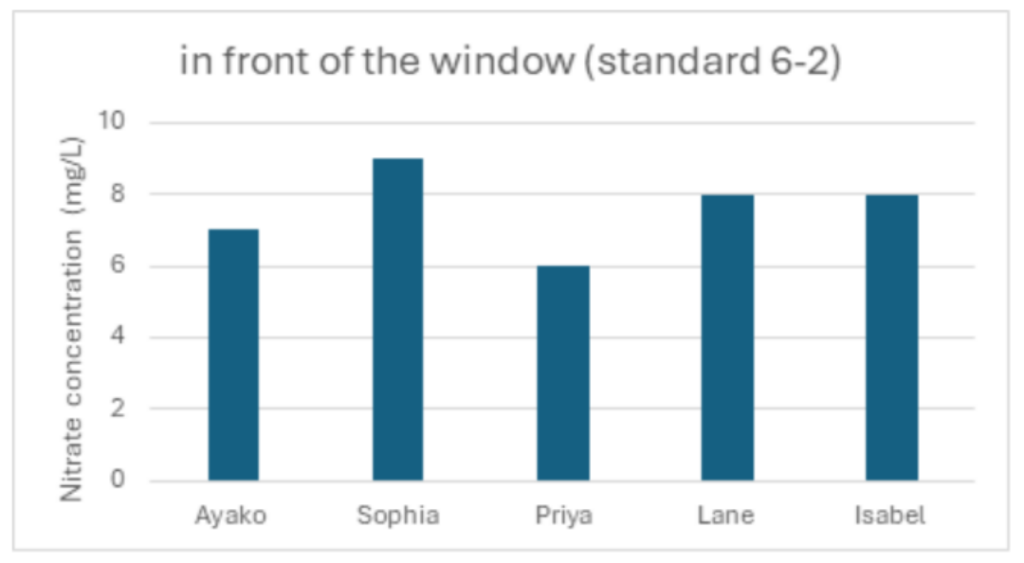
Figure 4: Data collected by five individuals in front of the window with the 6.0 mg/L standard.
The values varied widely in all standards and locations. Especially, for higher concentrations, the range between highest and lowest reading was ± 3.5 mg/L (Figure 4).
Discussion
From this result, ALLARM can suggest several tips to measure the most accurate value when using the nitrate kit. Since many factors affect color reading, it is hard to conclude this experiment with one suggestion.
The best light environment overall was in front of the window, which had the most accurate readings consistently both on sunny and cloudy days.
It is important to keep in mind that the octa-slide’s 0.0 – 2.0 mg/L range that is harder to distinguish the color and read the value (photo 3). When your sample has a low nitrate value, it is important to have light traveling through the sample and Octa-slide from behind (Figure 2 and 3).
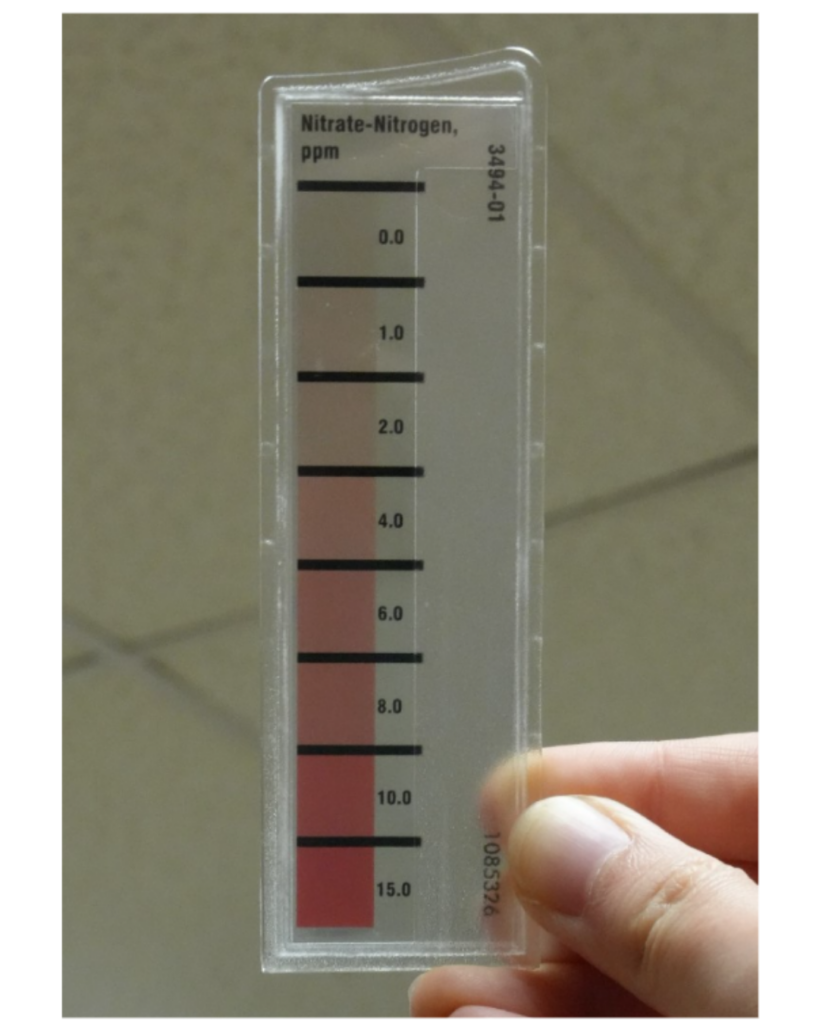
Photo 3: Octa-slide.
From table 4, the percent error suggested that higher concentrations have higher accuracy regardless of the light environment. Additionally, higher concentration standards were easier to read accurately, while lower concentration standards like 2.0 and 0.5 were often perceived darker for all locations and were off from the actual value by around 50%.
The experiment was supposed to be held on the same day with same people; however, it ended up being done on two different days under different weather. That also suggested that the weather affects how we perceive the color. If possible, the nitrate kit should be performed outside with natural light when it is sunny. However, it won’t always be sunny on sample collection days. We would recommend testing nitrate even if it is a cloudy day or under unideal conditions since nitrate is a time sensitive parameter and needs to be done as soon as the sample is collected. In that case, the second-best option is to test inside a building where enough lighting is provided, such as in front of a big window or facing artificial light. This experiment also showed the importance of meta data such as weather on the day of collection along with your values.
The results were surprising because it shows how different values can be with the same standard depending on each tester. Everyone has unique tendencies. For example, one tester tended to see color much darker than it is almost all the time. Others did not perceive the color differently in any environment. It may be helpful to ask several people as a second check or to take a picture of the bar and colored samples next to each other, so you have reference later.
This experiment gave us helpful insights on how to minimize human error while reading the kit and maintain the accuracy of the nitrate kits. Next time, this experiment could be carried out with a larger group and variety of testers. More standards can lead to better analysis, less bias and demonstrate wide variation in reading. During the experiment, Jill Ariola, ALLARM’s Staff Scientist, suggested a new way of comparing colors. She recommends putting the samples and Octa-slide 2 bar next to each other without using the black case (photo 4, 5). Comparing the sample colors that are next to the bar may be easier to see the difference than using a black case. This method can be used in further experiments.
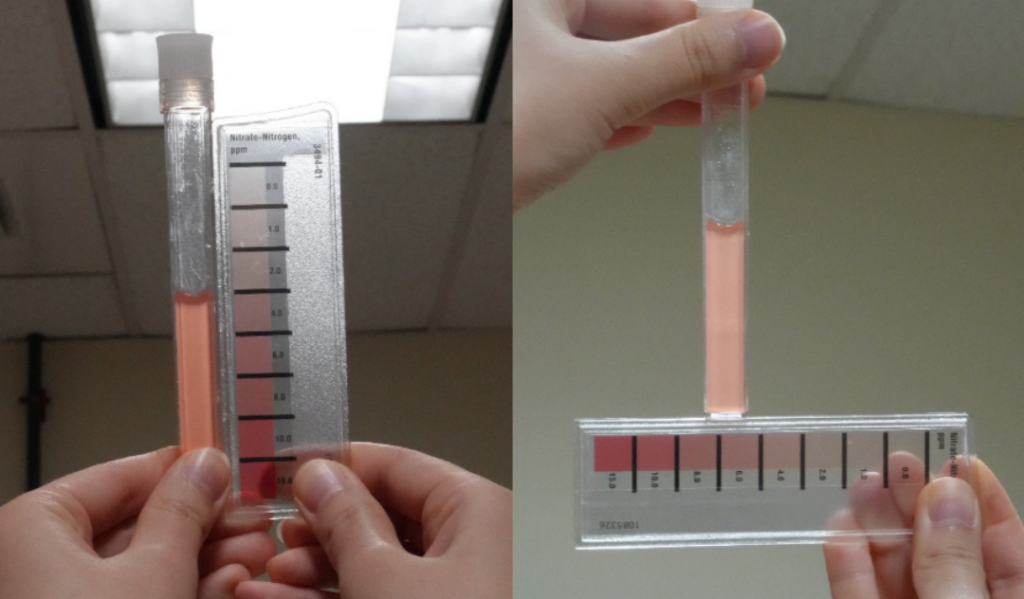
Photo 4, 5: Suggested ways to make color comparison easier.
This experiment supports how subjective the value measured with the kit can be. By analyzing them carefully, we found ways to increase accuracy based on light and weather conditions for testing.
References