
pH stands for “Potential of Hydrogen” which measures how acidic or alkaline a substance is. pH is an important indicator of stream health. At ALLARM, the LaMotte Precision pH Test Kit is used to measure the hydrogen ion concentration (pH) in water. The more hydrogen ions that are present, the more acidic is the solution (Wood Hole Oceanographic Institution n.d.). pH affects most chemical and biological processes in water (U.S. Environmental Protection Agency (EPA) 2026). It is one of the most important environmental factors limiting species distributions in aquatic habitats (U.S. Environmental Protection Agency (EPA) 2026). pH has a scale from 0 (more acidic) to 14 (very basic). The normal pH of stream water is between 6.5 to 8.5, which is ideal for the survival of aquatic life, including fish reproduction and aquatic insect life. However, if pH becomes too low or too high, it can have harmful biological effects on stream health and biodiversity. For example, both low and high pH levels can reduce the number of species, decrease growth, and lower reproduction rates.
Using the LaMotte kit and the Octa-Slide 2 comparator (Figure 1), we can determine pH levels. LaMotte Precision pH kit is an easy and accessible method for testing pH levels. However, because it uses a color scale, it can be difficult to determine an accurate result. This is because different people may perceive colors differently, which can make it harder to obtain an error-free measurement. In addition, the color of the test result and the slide color can appear different under various lighting conditions, making accurate reading more difficult. There are also many other different methods for pH testing, such as pH-indicator strips and the Hach Pocket Pro + tester.
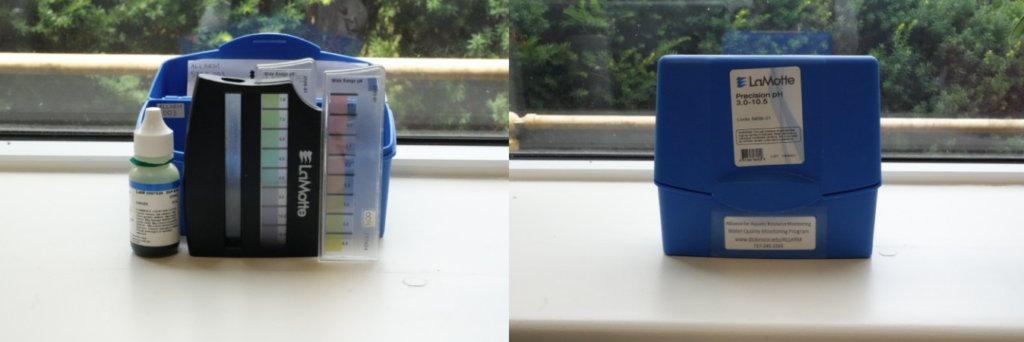
Figure 1: LaMotte pH test kit with Octa-slide color comparator, Octa-bar and reagent bottle.
This experiment was designed to show how different lighting environments can affect our results and to identify the best lighting conditions for this experiment, producing results that are as close to accurate as possible.
Methods
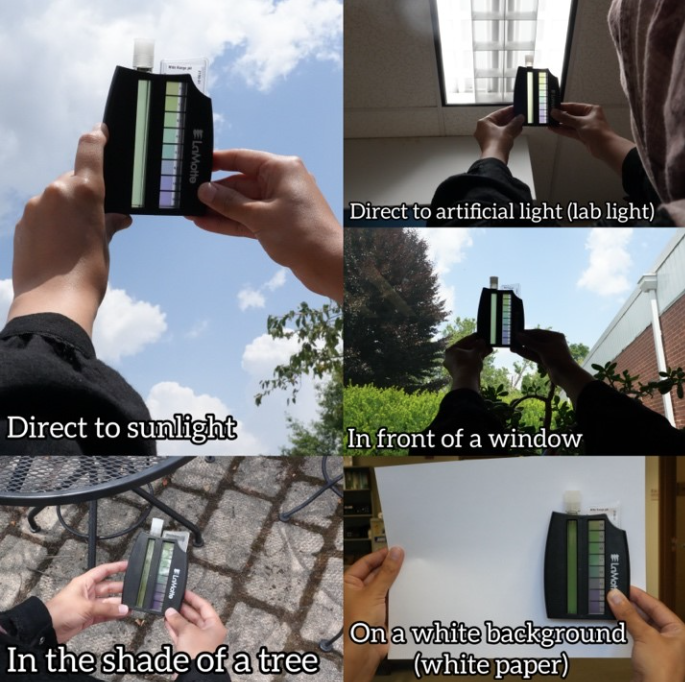
Figure 2: Different light environments used in this experiment. The right side of this figure shows indoor light sources, and the left side shows outdoor light sources.
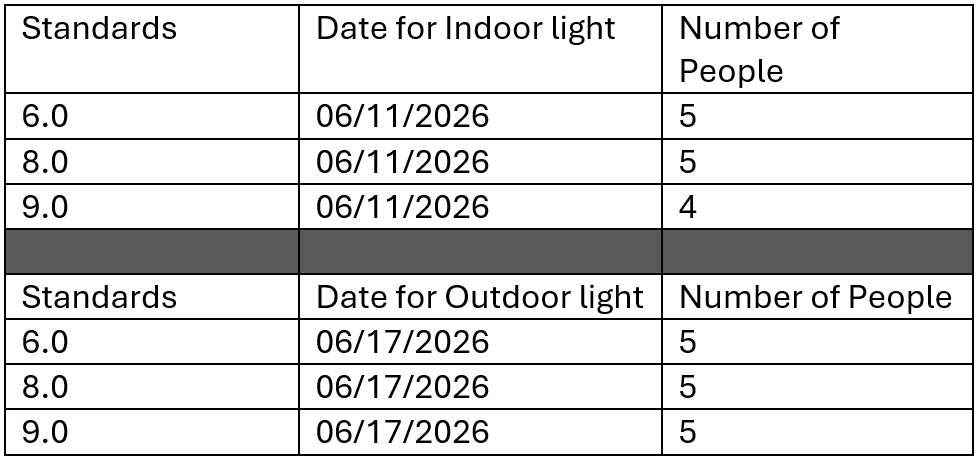
Table 1: pH standards used in this experiment.
Before performing the experiment, I tested each standard to verify the values of the pH standards, using a Fisherbrand Accumet XL200, a high precision instrument. I used the LaMotte Precision pH kit for this experiment (Figure 1). This is the kit we use at ALLARM, and our volunteers use this for monitoring stream pH. Three different pH concentration standards were used to compare the measured values with the actual value, 6, 8, and 9 (Table 1). Five ALLARM members, including full-time staff members and student watershed coordinators, participated in the experiment. I conducted the experiment at the ALLARM office on the same day at and at the same time for each light source.
After collecting data for this experiment, I recorded it in an Excel Spreadsheet. I organized the data into five categorized datasets based on the specific lighting conditions to enable better comparisons and ensure accurate results. In each dataset, the perceived pH values (for pH 6, pH 8, and pH 9) are tracked individually for each participant to clearly show how different light resources affect color perception.
Results
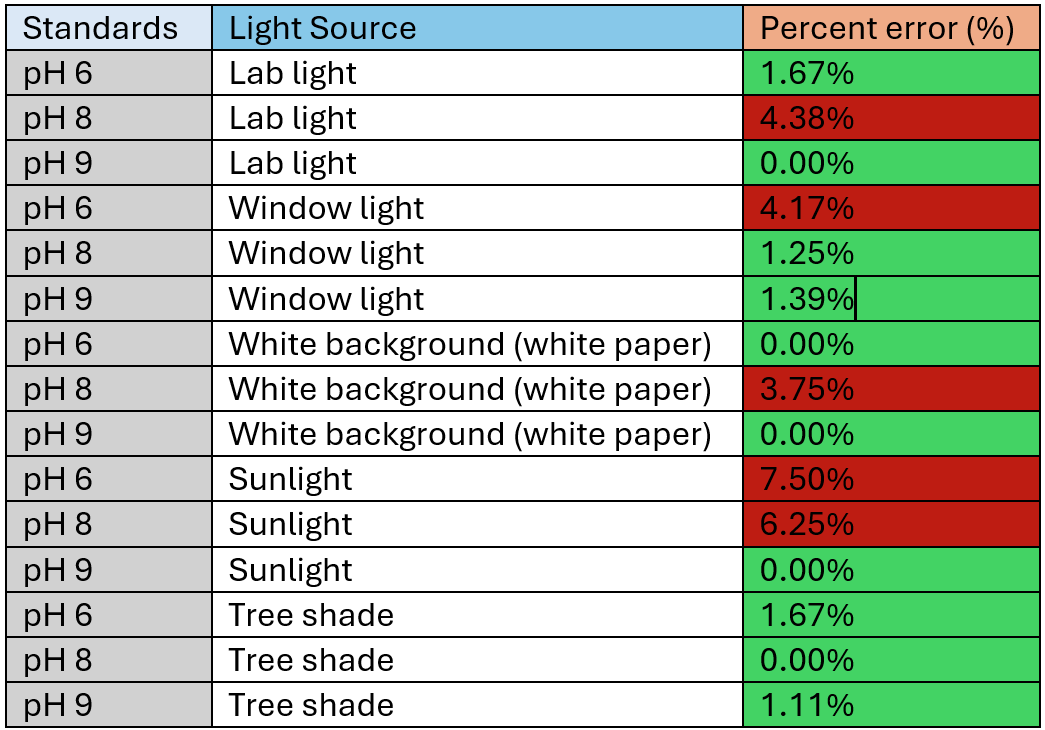
Table 2: This table shows the percent error (%) for three different concentration standards across different environments. The red color on this table indicates the highest error, and the green color indicates the lowest error or zero.
In Table 2, the highest error is 7.50% at pH 6 in the sunlight light source. The lowest error is 0.00%. This was case for pH 6 on white paper, pH 8 in the shade of a tree, pH 9 in white paper and in sunlight, and for pH 9 in lab light. Therefore, as shown in Table 2, lower concentration (such as the pH 6 standard) produced higher errors, while pH 9 had lowest error overall.
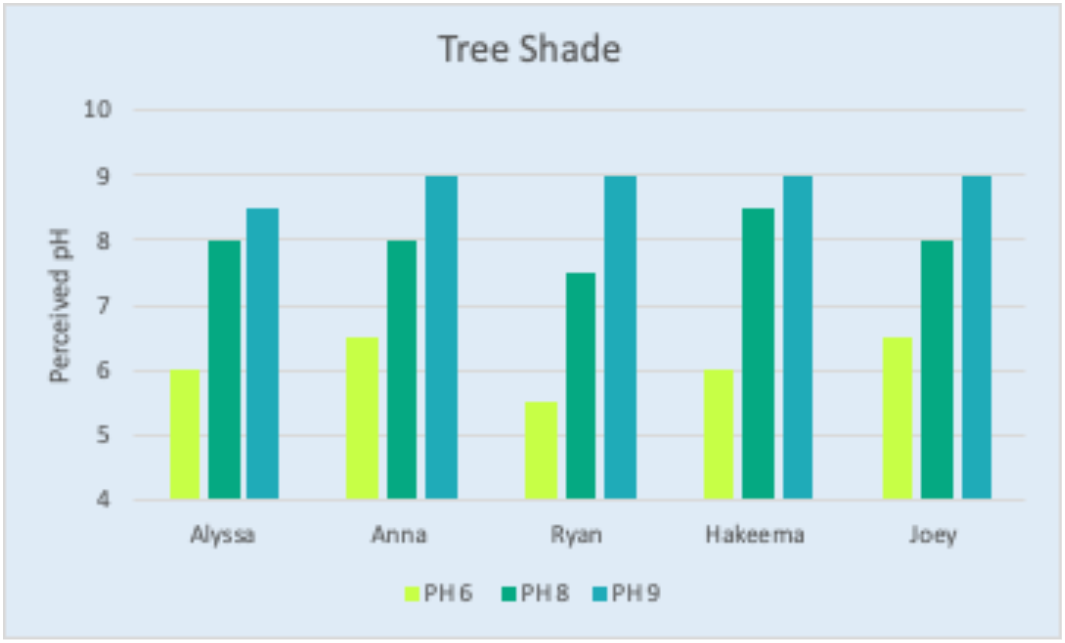
Figure 3: Results for pH 6, 8, and 9 in the shade of a tree.
Looking at Figure 2 and the results in Table 2, we can analyze that the shaded tree produced the lowest percentage of error for all standards. In addition, pH 9 was read correctly by 4 out of 5 participants.
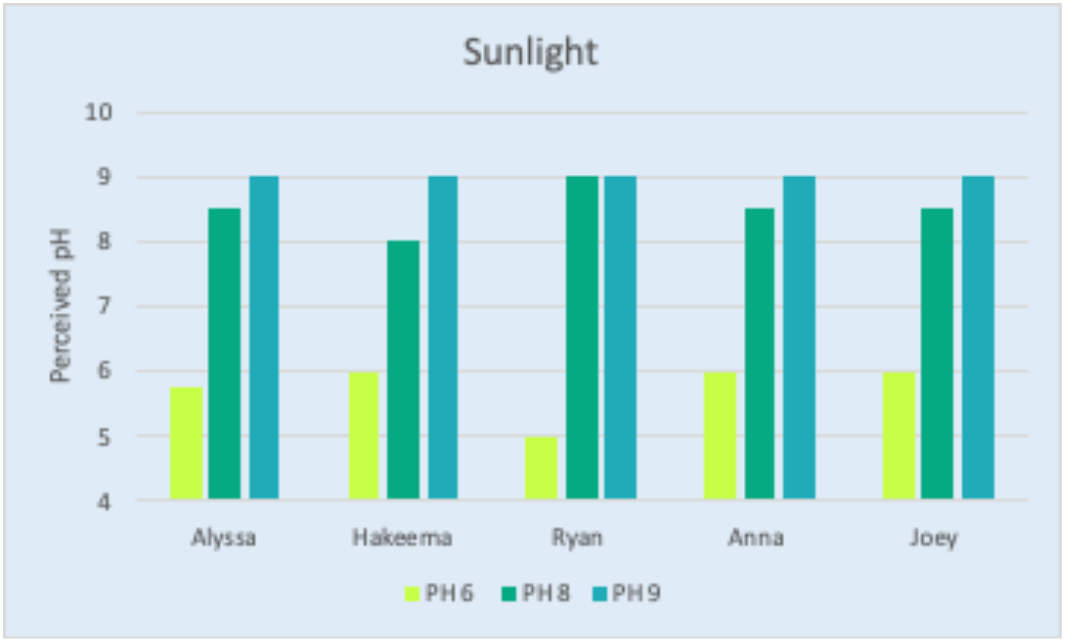
Figure 4: Results from direct to sunlight for the pH 6, 8, and 9 concentration standards.
From Figure 4 and Table 3, the highest error was caused by direct exposure to sunlight. This light source made the results differ significantly from the actual values, especially the results at a pH of 6 concentration. However, at pH 9, all participants read the values correctly.
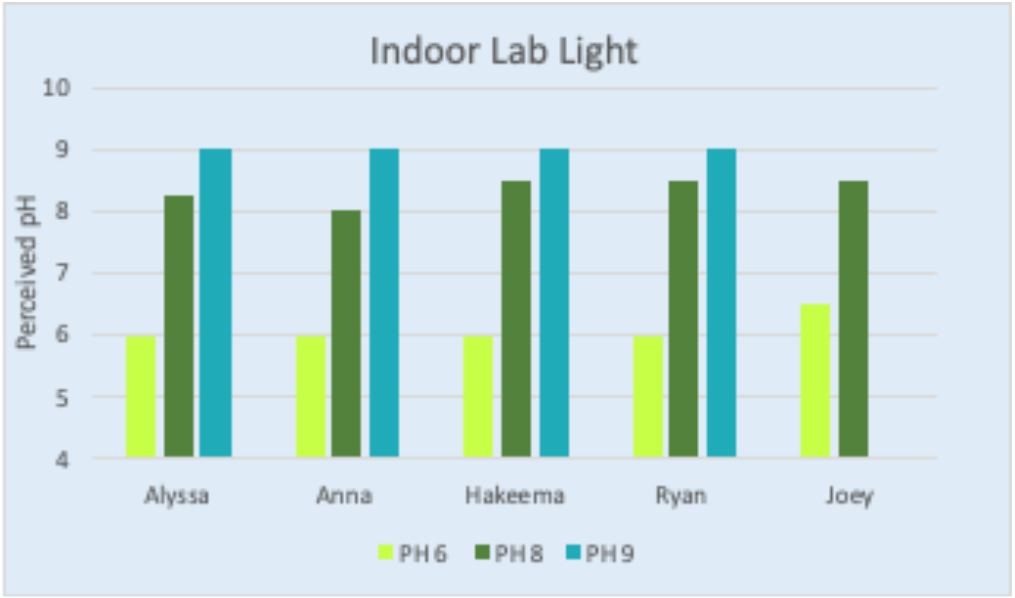
Figure 5: Results from direct to lab light for the pH 6, 8, and 9 concentration standards.
The artificial light (lab light) caused less error for the pH 6 concentration compared to the other light source; it was read correctly by 4 out of 5 participants. The lab light was also a good light source for the pH 9 concentration because it produced the same results for everyone.
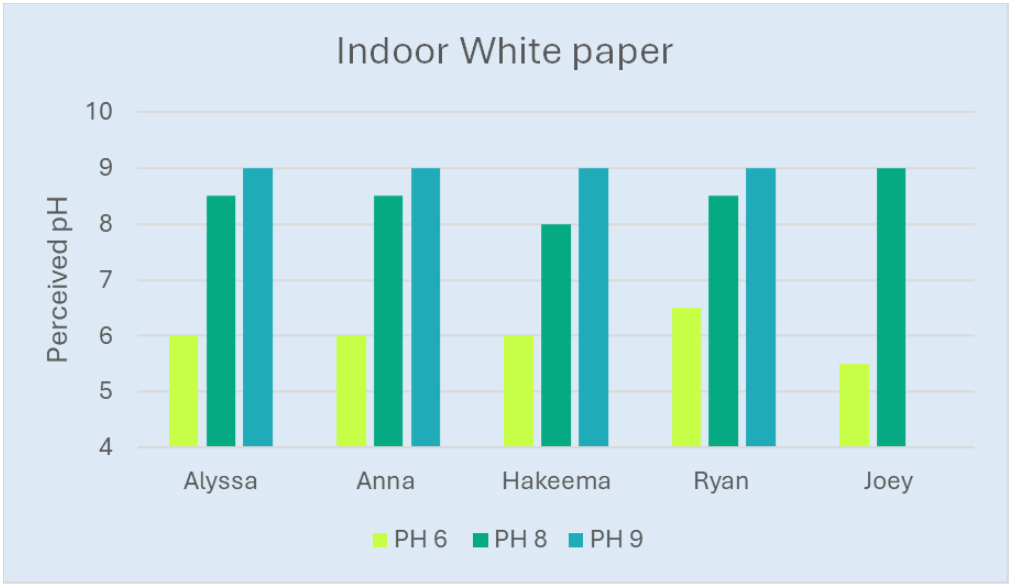
Figure 6: Results from on white background (white paper) for the pH 6, 8, and 9 concentration standards.
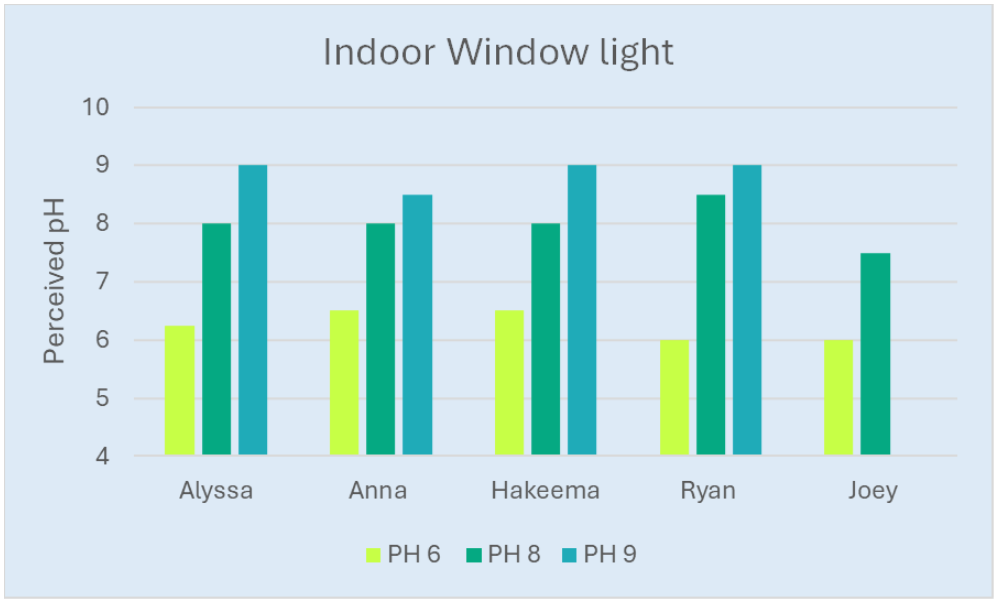
Figure 7: Results from in front of a window for the pH 6, 8, and 9 concentration standards.
For each standard tested in different environments, the results differed from the actual values—especially for pH 6 and 8. However, for pH 9, the result were almost the same for every light source expect for the window light.
Discussion
The data from the results shows that, for each pH standard, we used different environment light sources that were helpful. However, there is not one light source that provides clear reading for all standards for all participants.
Overall, for high pH concentration standards, such as pH 9, the best light source was shade of a tree, and this source produced the most accurate results. For the lower standards, such as pH 6, artificial light or indoor lighting produced the most accurate results. However, according to our data, pH 6 still had more inaccurate results compared with the other standards.
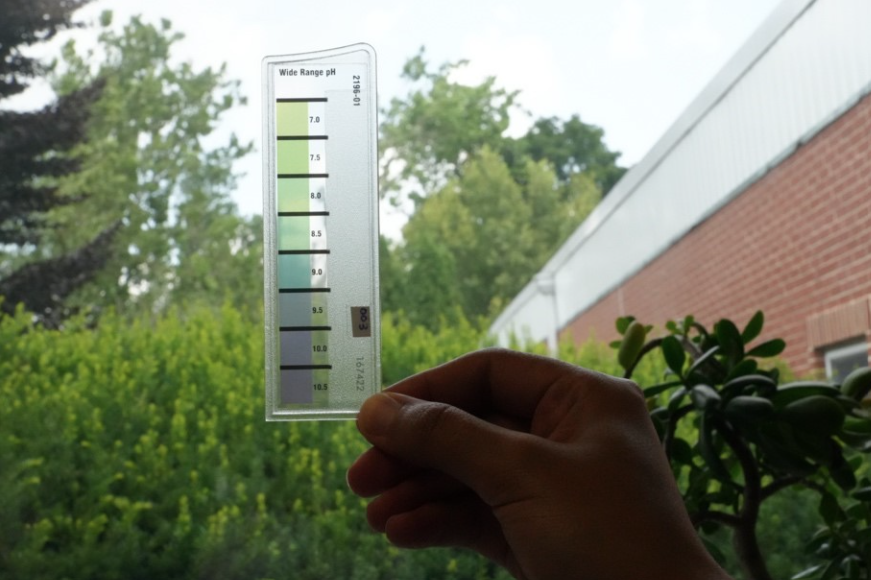
Figure 8: Octa-slide without black case.
From the Table 3, we can see that the most accurate results were obtained for high pH standard (such as pH 9) in every different environment. This suggests that results are easier to distinguish in the presence of higher pH standards. However, for low pH standards (such as pH 6) it’s difficult to distinguish. In contrast, low pH standards (such as pH 6) are more difficult to distinguish accurately.
This experiment was conducted on two different days under the same weather conditions. One factor to keep in mind is that cloudy weather can also affect the data results. If the experiment is performed outdoor on a cloudy day, there may be less available light, which increase error because enough light may not reach the sample. Although the results in Table 3, indicates that the shade of a tree is a better light source, the shade conditions were only applicable for sunny days; on cloudy days, the shaded area would likely be darker and may not provide sufficient light. Finally, because pH becomes time-sensitive once pH indicator is added, it is not good to wait for a sunny day, and it is best to perform the experiment indoor with sufficient lighting, such as direct artificial light (Figure 2).
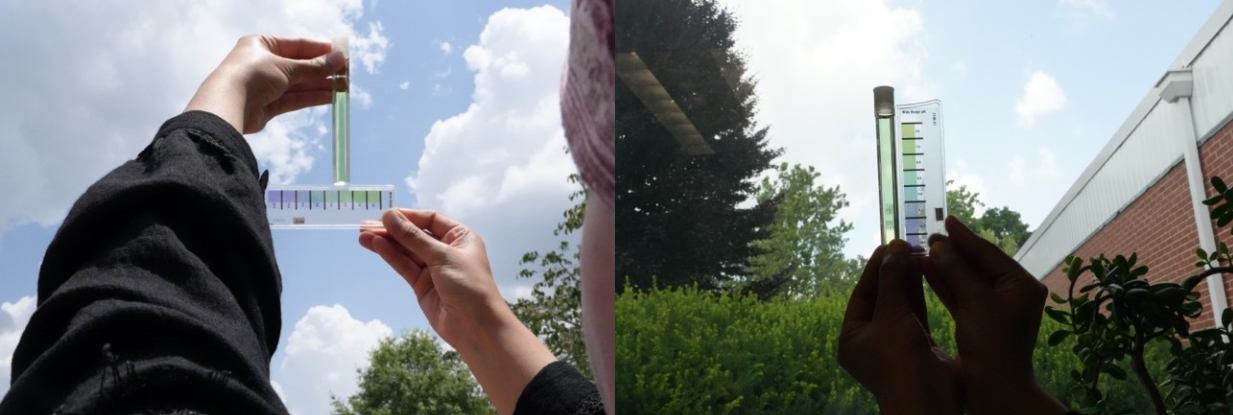
Figure 9: This figure shows Octa-slide without their black case held next to the sample on the right, and one sample held over an Octa-slide on the left.
One other suggestion we can give is to hold your sample over the Octa-slide or next to each other without using the black case (figure 9). This makes it easier to read the results because more light will reach the sample. Sometimes reading with the black case will block the light and the color scale, which makes it difficult to read. Also, without the black case, we can put our sample near each color scale, which makes it easier to compare.
One important fact about this experiment is that one of our participants is red-green color blind. Therefore, we tested whether the Precision pH kit method is color-blind friendly. However, according to the results and participant’s comments, it was difficult for them to read the results and about half of their readings involved guessing. We therefore suggest that the kit is not red-green color-blind friendly.
In conclusion, this experiment was designed to determine the best light source for accurately reading pH standards. According to our results, we can suggest that the most error-prone light source is in the shade of a tree on sunny days. The experiment was helpful in showing human error and how each person perceives color in different environments. Finally, we can minimize our error by being more careful and it is also best to have more people take readings as a second check to achieve more accurate results.
References
1. “The pH Scale,” Woods Hole Oceanographic Institution, accessed June20, 2026, https://www.whoi.edu/ocean-learning-hub/ocean-topics/how-the-ocean-works/ocean-chemistry/ocean-acidification/the-ph-scale/.
2. US Environmental Protection Agency. “pH.” Causal Analysis/Diagnosis Decision Information System (CADDIS). Accessed June 20, 2026. https://www.epa.gov/caddis/ph.