On Wednesday April 13th, Julie Vastine (Director), Candie Wilderman (ALLARM’s Founder and Science Advisor), Stephanie Letourneau (Community Science Specialist), and Phoebe Galione (Outreach Manager) presented a two-hour long, virtual workshop to Stream Team volunteers across Pennsylvania about how to find the stories hidden within their data. This workshop took months of preparation by the entire ALLARM team, and consisted of downloading and organizing data from the Chesapeake Data Explorer, creating bar graphs and maps for each site, and putting it all together into county-specific data packets. I had the opportunity, along with other watershed coordinators, to sit in on the workshop to see the culmination of our hard work.
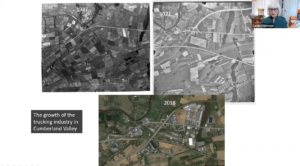
Overall, I really enjoyed the event. The ALLARM team did an amazing job interacting with the volunteers and presenting the information needed to aid them in taking a closer look at the data. The supplemental maps and site information provided, along with the water quality influencers and policy discussions given by Candie and Julie, gave the needed context to turn numbers into stories. I particularly enjoyed learning about the factors that contributed to differences in the data when looking at each site. As Candie explained, geology plays a huge role in water quality. For example, limestone easily dissolves in water. This can contribute to higher conductivity readings, as well as act as a pH buffer, which could reduce the acidity in the waterway. This contrasts with other streams which contain other types of streambed material, like shale, which would reflect differently in the data. Another fact that I found interesting was that urban development, such as warehouse construction for trucking, has contributed to higher conductivity and nitrate-nitrogen values, similar to sites being impacted by agriculture.
Regarding the volunteers, it was great seeing how engaged and excited the they were to interpret their own data and share it with others in their community. One of the volunteers is a schoolteacher and even hopes to integrate his findings into his lesson on aquatic ecology! All monitors will have an opportunity to attend an additional data interpretation meeting in early June where they will be able to present their findings to other Stream Team volunteers. I am ultimately looking forward to seeing the additional site-specific context the volunteers will be able to provide and to hear their interpretation of the stories hidden in their data!

