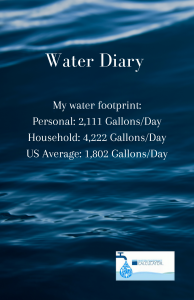
My average water footprint is approximately 2,111 gallons per day and 693.4 m³ per year. My household water footprint is approximately 4,222 gallons per day while the US daily average is 1,802 gallons per day.

My average water footprint comprises mostly of outdoor and virtual water uses which include diet, electricity, and activities like driving and shopping. One thing I take pride in is my low indoor water consumption. I make an extra effort to not spend more than 15 minutes in the shower and I always put a bucket in the shower while I am waiting for the water to warm up. Later, I use that to water my indoor plants.
However, one thing I am not happy with is my average household water footprint (4,222 gallons/day) which is almost twice as much as the US daily average (2,220 gallons/day). This is mostly because of the excessive meat consumption in my household. Our household consists of two people including myself and both of us are regular meat eaters, hence our daily water consumption through food is 854 gallons per day. This test, indeed, has been eye opener for me and I plan to make better food choices in the future.
When comparing results from countries in my sub-region of specialization, the Arabian Peninsula with the United States, it is evident that the U.S. consumes more water per person than any other country. The average water consumption in the country is 820 000 million m3/year.
On the other hand, water footprints of countries in the Arabian Peninsula are as follows:
Yemen: 17 000 million m3/year
Kuwait: 4 700 million m3/year
Saudi Arabia: 39 000 million m3/year
United Arab Emirates: 10 000 million m3/year
Oman, Qatar, Bahrain: No data available.
According to a study done by usgs.gov, water use in the United States in 2015 was estimated to be about 322 billion gallons per day (Bgal/d) and it has only increased since then with thermoelectric power and irrigation being the two largest uses of water. Moreover, managing water has become a growing concern in the U.S. Communities across the country are starting to face challenges regarding water supply. Many of the states are facing an increase in population growth which leads to a higher consumption of water. On the other hand, the Arabian Peninsula, one of the driest parts of the world, is already passing the water scarcity line as defined by the World Health Organization (WHO). The scarcity of renewable water resources and the growing discrepancy between demand and supply of water is a major challenge for the region. Water scarcity is further worsened by rapidly growing demands due to rapid population growth, unsustainable consumption, climate change and weak management institutions and regulations (Odhiambo, 2017).
References used:
Dieter, C.A., Maupin, M.A., Caldwell, R.R., Harris, M.A., Ivahnenko, T.I., Lovelace, J.K., Barber, N.L., and Linsey, K.S. 2018. “Estimated use of water in the United States in 2015,” U.S. Geological Survey Circular 1441, 65 p., https://doi.org/10.3133/cir1441.
Hoekstra, A., Heek M., 2020. “National water footprint explorer”
https://waterfootprint.org/en/resources/interactive-tools/national-water-footprint-explorer/
Odhiambo, George. 2017. “Water scarcity in the Arabian Peninsula and socio-economic implications.” Applied Water Science.
Water Calculator: https://www.watercalculator.org/wfc2/complete/