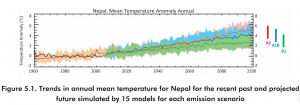
Climate models help show different scenarios as to what could happen. For example, some models run their simulations as if there will be no attempts to mitigate climate change, while others show what would happen if the greenhouse gas (ghg) emissions stayed constant to their current level. This variance in scenarios is importance because it takes in to account one the of the largest reasons that future climate is so uncertain. The amount ghg emissions directly impacts the temperature of the Earth. By running scenarios with different amounts of ghg emissions climate models show a wide range of outcomes that could be the future of Earth’s climate.
As seen in the climate model below, each situation provides a range of the different outcomes from each scenario as well as a median line. These ranges show outcomes from every climate scenario ran, which is helpful because it can inform decision makers of what they can expect for future climates relative to mitigation efforts.

Climate models can also represent the importance of acting against ghg emissions as shown in the four degrees Celsius gap from the median of scenario A2 to the median of B1. The increase of global temperatures has extremely negative global connotations so the fact that climate models can show how much change mitigation can make is inspiring.
Regional climate models are another tool for local and national governments when making decisions regarding climate of the future. These localized maps show expected changes in small given areas, such as states and counties. When deciding on ways to approach future climate this information is helpful as it provides a region specific picture of what is likely to occur in a given area.
One limitation for using climate models can be seen particularly in precipitation models. These models provide a range of likely outcomes of future climate, yet nothing shown is definitive. The inconsistency is results from these scenarios is highlighted in precipitation models. For example, in Nepal the climate models predict “changes between -30% and +100% in the annual rainfall” (p. 57). The change in -30% and 100% precipitation would have vastly different impacts of on life, agriculture, flooding, droughts, in Nepal so, it would be hard for decision makers to use that information to create effective policy. However, the models did show that an increase in the amount of rain days with 10 mm or more.
It can also be hard to make decisions using climate models on temperature. While the information provided in climate models show a clear trend in the likelihood of an increase in global temperatures, the exact amount of an increase is very hard to pin down.
Bibliography:
IDS-Nepal, PAC and GCAP (2014). Economic Impact Assessment of Climate Change In Key Sectors in Nepal. IDS-Nepal, Kathmandu, Nepal.
