Water is essential for life, and yet, it occupies so little space in the minds of most Americans. I, for one, rarely consider the commodity beyond basic thoughts of hydration. For me, clean water is a given, unlimited access an expectation.
Across the globe this is not the case.
In the Middle East North Africa region in particular, water has become a source of crisis and conflict; it impacts political life and dictates state relations. But why might this be the case? How can water be a mundane commodity in one place and the driver of international relations in another? To answer this question, I decided to explore the data beginning with individual statistics and making my way up to state-level water footprints.
To begin, I tracked my own water usage throughout a typical day. Then, using a Water Footprint Calculator I estimated daily consumption.
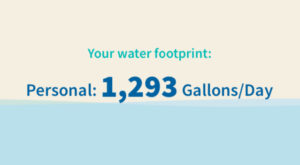
Photo Courtesy of https://www.watercalculator.org
The findings: I use 1,293 gallons of water a day, or about 4,895 liters. This number, although it seems high, falls below the U.S. daily average. It is also within the same range as per capita estimates for daily water usage in the Tigris-Euphrates Valley (summarized in the graph below).
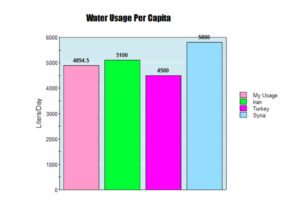
Graph Courtesy of https://nces.ed.gov/nceskids/createagraph/
So on an individual level at least, figures are not so different. But what about country-level footprints?
According to WaterFootprint.org, The United States uses roughly 820,000 million liters of water a year whereas Turkey uses barely more than ⅛ that figure. Population size, of course, plays a role in these data, but, likely, this is not the only factor.
Interestingly, despite differences in levels of consumption, the percentage of internal water usage versus external across the states is almost identical, with the U.S. water footprint made up of 80% internal usage and Turkey coming in at 79%. Iran and Syria were not far off these figures.
Overall, when simply looking at the data, it appears (apart from total national footprint) countries in the Middle East are not so different in water usage patterns. But is this truly a reflection of water in the region?
The simple answer is no, and data without context can be misleading.
Iraq, which is facing a severe water shortage and has already witnessed the displacement of over 20,000 people due to water scarcity, did not report official data. Simple averages also fail to account for water allocation. Total usage divided by population yields a quantifiable number, but it does not mean all citizens within a country have equal access to that amount of water. Even my own usage does not reflect U.S. averages, and it is not difficult to imagine how different the numbers may be if my water consumption was compared with a typical, non-agricultural worker in southern Iraq where water scarcity is most critical.
Beyond the indiscriminate nature of averages, data also fail to account for the daily and political struggles associated with a changing climate. Regionally, relations are heavily influenced by the politics of upstream versus downstream states; the water crisis promoting cooperation one moment and sparking conflict the next. Within individual countries, the movement of peoples away from rural farmlands and toward more populous cities has caused unrest and heightened dissatisfaction with current regimes. The growing water shortage has also spurred international involvement in the region with the UN and other organizations working to combat the many crises that have arisen over the past decade.
Overall, while the data paints one picture, reality shows a very different landscape. When looking at numbers, the implications of low levels of water security in the Tigris Euphrates Valley looks like this:
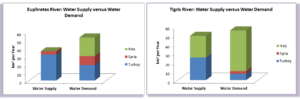
Graph Courtesy of http://globalwater.pbworks.com
But when you look beyond the numbers, reality is closer to this:
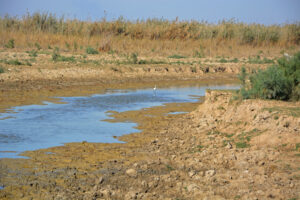
Photo Courtesy of https://www.undp.org/iraq/blog/water-security-provides-opportunity-achieve-peace-and-development-iraq
Leave a Reply