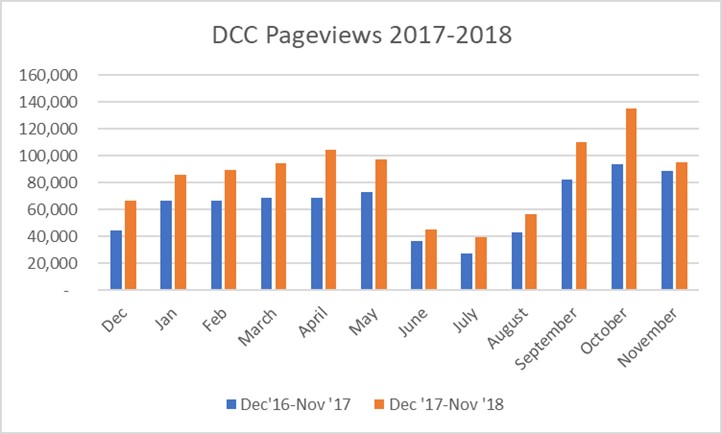
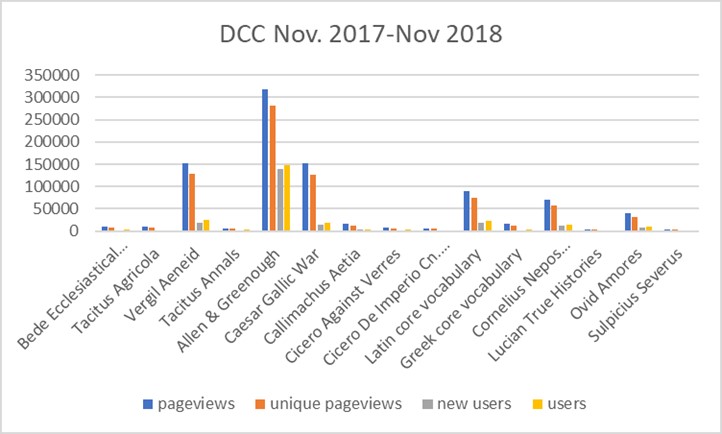
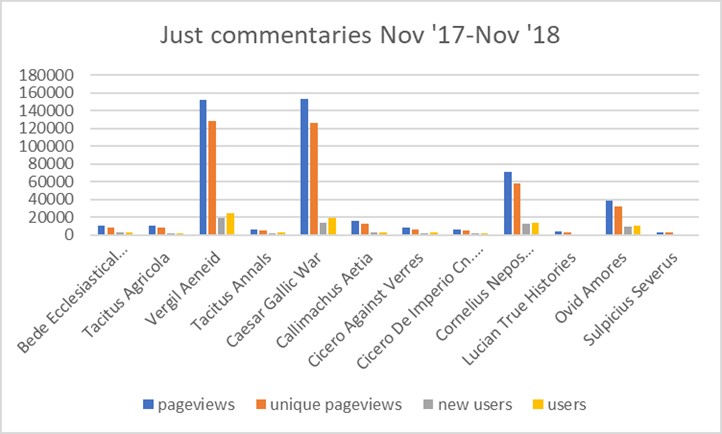
This is the time of year when I examine the site analytics for DCC, ahead of the editorial board get together at the SCS annual meeting. Use of DCC continues to grow, according to Google Analytics. In the last calendar year the site had a total of 1,033,730 page views, a new high. The graphs below show (1) the growth over last year; (2) the most popular parts of the site (Allen and Greenough continues to prevail there), and (3) the most popular commentaries, excluding the reference works. All this is for December 2017-November 2018. Monthly data in four different metrics for each commentary is on the site. Thank you to all the many scholars—students, secondary teachers, and college and university faculty—who have contributed to DCC this year. Thanks are also due to the editorial board for their work on peer review and editing, and to our fine Drupal developer Ryan Burke of Dickinson’s Academic Technology office. Happy Holidays, everybody!

1: DCC total monthly page views, 2017-2018

2: DCC analytics by content type, December 2017 to November 2018

3: DCC analytics, Nov. 2017 to Nov. 2018 just commentaries, not reference works
Analytics term definitions:
Pageviews: the total number of pages viewed over the date range in question. Repeated views of a single page by the same user are counted. A Pageview is counted every time a specific page is loaded.
Unique Pageviews: the number of sessions during which the specified page was viewed at least once. Unique Pageviews are counted for every session, including distinct sessions by the same user during the specified date range (30 minutes of inactivity ends a session). A Unique Pageview is counted for each page URL + page Title combination.
Users: distinct IP addresses that have had at least one session within the selected date range. Includes both new and returning Users. A User is counted in every session that User visits the site or a commentary during the selected date range. Subtracting the figure for New Users from this figure yields the number of people who visited, left, and returned.
New Users: the number of first-time Users (distinct IP addresses) during the selected date range. They may be returning Users from a time before the selected date range.