Does Money Grow from Saving Trees?

money on trees

Profits do come when you save. Authors in a recent study found that when companies invested in green information technology (IT), their profit margins increased. Technology is an unexpected greenhouse contributor. However, our society’s increasing reliance on technology makes it a source of large energy consumption. In a previous study, Belkhir and his coauthors found that information and communication technology (ICTs) devices and services such as smart phones, tablets, displays, and data centers contributed 33% of the total global greenhouse gas emissions in 2010.

Companies feel obligated to adopt sustainable practices in their operations or supply chain due to pressures from various entities like the Business and Sustainable Development Commission, the United Nations, investors, consumers, and governments. These entities want to reduce the environment impact of technology.  When companies reduced the environmental impact of their operations, and incorporated sustainability objectives to their operations and management practices, their profits increased. Furthermore, the incorporation of sustainable objectives reduced the energy consumption from IT equipment, which lowers the energy cost.

From their results, when companies spend more of their overall IT spending on green IT, profits increased, as well as energy consumption. Additionally, the authors found a difference in green IT implementation based on operation-oriented and supplier-oriented platforms. When their operational based implementation, the company conserved more energy and collected more profits. Whereas, a supplier based platform allowed them to conserve with little financial returns.

From a marketing perspective, this may be an ideal way for companies to adopt sustainable practices that supports their business model and finances. However, if the problem of climate change derives from intense extraction of natural resources and human overconsumption, how would this encourage people to change their consumptive patterns? Rather than relying on technology to solve our problems with our changes to our practices. This maybe a good starting point to gather more support. However, do you think this is a lasting solution?


Source: Khuntia, J, Saldanha, T.J.V., Mithas, S., Sambamurthy, V. Information Technology and Sustainability: Evidence from an Emerging Economy.

Birds: The Signal of Climate Change in National Parks

Researchers at the National Audubon Society analyzed how climate change will effect birds in the United States National Park System. Birds are sensitive to their environment. They are mobile, responsive, and conspicuous. Birds are also an economic attraction to National Parks, contributing $107 billion to the industry for bird watching.  To determine how birds would be impacted, Wu and their colleagues analyzed 513 species across 274 national parks based on high and low greenhouse gas scenarios. They used their analysis to determine the climate suitability of the birds. Afterwards, they classified the species under five categories: improving, worsening, stable, potential colonization, and potential extirpation (local extinction).

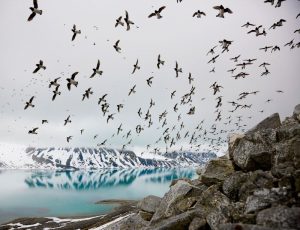
fying birds above ice
Image from New Scientist

From their results, 24-50% of these birds are highly vulnerable to climate change. Also, highly sensitive birds are 21% more likely to lose half of their climatic suitability by mid-century. Birds from the Great Lakes region, most migratory species, were more likely to be vulnerable species. Despite most of these species categorized as vulnerable species, their model predicted that potential colonization are more likely to occur than extirpation during a high greenhouse scenario. More potential colonies transpire in the winter, 42.1 species, rather than the summer, 22.5 species. This would increase the species richness within the parks, which measures the count of species within an ecological community. Wu and their coauthors explain that birds are responding to warmer winters by making more colonies in the North, such as the Midwest and Northeast. During the stage of potential colonization, the present conditions for the birds are dismal, but they are projected to improve overtime to be suitable in that location.

Researchers at the National Audubon Society analyzed how climate change will effect birds in the United States National Park System. Birds are sensitive to their environment. They are mobile, responsive, and conspicuous. Birds are also an economic attraction to National Parks, contributing $107 billion to the industry for bird watching.  To determine how birds would be impacted, Wu and their colleagues analyzed 513 species across 274 national parks based on high and low greenhouse gas scenarios. They used their analysis to determine the climate suitability of the birds. Afterwards, they classified the species under five categories: improving, worsening, stable, potential colonization, and potential extirpation (local extinction).

From their results, 24-50% of these birds are highly vulnerable to climate change. Also, highly sensitive birds are 21% more likely to lose half of their climatic suitability by mid-century. Birds from the Great Lakes region, most migratory species, were more likely to be vulnerable species. Despite most of these species categorized as vulnerable species, their model predicted that potential colonization are more likely to occur than extirpation during a high greenhouse scenario. More potential colonies transpire in the winter, 42.1 species, rather than the summer, 22.5 species. This would increase the species richness within the parks, which measures the count of species within an ecological community. Wu and their coauthors explain that birds are responding to warmer winters by making more colonies. During the stage of potential colonization, the present conditions for the birds are dismal, but they are projected to improve overtime to be suitable in that location.

These projections are important to park management and policy.  The current management style focuses on landscape-scale conservation. However, the authors suggest the National Park Service adopt a climate-informed conservation strategy that increasing habitat mobility and restoration. From this strategy, the authors hope to instill resistance (protecting highly valued resources) and resilience (improving species capacity).

To learn more about the effects of climate change on birds, follow the links below:

http://climate.audubon.org/

https://climatekids.nasa.gov/extreme-weather-birds/

Source:

Wu, J., Wilsey, C.B., Taylor, L. Schuurman, G.W. 2018. Projected avifaunal responses to climate change across the U.S. National Park System.  PLOS ONE: https://doi.org/10.1371/journal.pone.0190557

Experimental Fix to Melting Ice Sheets

Is there a cost to global sea level rise? Yes, approximately $50 trillion per year in damages.  The infrastructure needed to create and maintain sea walls and flood defenses cost tens of billions of dollars a year according to John C. Moore. What is adding to the cost? The infrastructure costs approximately $20-33 billion to build. For the installment of the Three Gorges Dam in China spend $33 billon to construct the dam.

Most of the water from sea level rise will come from the melting ice sheets in Greenland and Antarctica.

ice melting in Antarctica

In their research, they explore three ways we can delay the loss of ice sheets. They suggest to block warm water, support ice shelves, and dry subglacial streams. Note that all of these potential solutions could disrupt natural ecosystems, fisheries, tourism, and water flow. However, Moore and his co-authors argue their solutions may be worth the risk to the present dilemma in the rise of global sea levels.

To block warm water from the Atlantic Ocean, the authors suggest constructing a 100-meter-high wall with sliding sides along the 5-kiometer fjord in front of the Jakobshavn glacier near western Greenland. A fjord is a narrow inlet with steep sides or cliffs created by a glacier. The importance of this project would be similar to other large civil-engineering projects like the Suez Canal in Egypt, Hong Kong airport, Three Gorges Dam in China. However, this project would need 0.1 cubic kilometers of gravel and sand compared to 1, 0.3, or 0.028 cubic kilometers of material needed for the projects in Egypt, Hong Kong, or China.

The Jakobshavn glacier is one of the fastest moving ice masses on Earth, and it contribute to most of the sea level rise than other glaciers located in the Northern Hemisphere. Furthermore, 4% of twentieth century seal level rise can be attribute to this glacier.

For their second solution, Moore and his co-authors they would construct a berm (raised banks bordering river or canal) and islands to artificially pin ice shelves in front of the Pine Island and Thwaites glaciers in West Antarctica. Ideally, this would temporary prevent the movement of the glacier. Similar to the first plan, these materials need to be outsourced to material to build the berm and island.   Models predict that Pine Island Glacier and Thwaites will be the largest source of se level rise in the next two centuries, contributing 4 centimeters a year.

For dry subglacial streams, they want to reduce the rate of melting by removing the glacier’s ice bed to reduce frictional heating in Antarctica. When they remove the ice bed, they will use a pumping station to extract or freeze the water at the glacier’s base to slow sliding. This process would be important to mitigate sea level rise because glacier ice beds supply 90% of ice in the sea.

With this intensive construction and extraction of materials, do their plans sound plausibly or worthwhile? The authors leave it to other glaciologist and engineers to test their projects.  Also, if this plan does carryon, who will need to approve this project? This project may result in global consequences if they do not structure it properly. What are your thoughts on this project?


Source:

Moore, John C. et al. 2018. Geoengineer polar glaciers to slow seal-level rise. Springer Nature 555: 303-305.

What do wastewater and earthquakes have in common?

Researchers predict that the second highest earthquake in Kansas between 2013-2016 resulted from the deep injection of wastewater from the oil and gas production. These earthquakes occurred in southern Kansas, frequently in Harper County and neighboring counties. Historically, the magnitude of earthquakes in southern Kansas where below 2.0. However, they peaked in 2015 with 51 earthquakes above the magnitude of 3.0.

For their study, they focused on Sumner and Harper County in southern Kansas. Oil and gas operation began in Sumner County in 1915 and in Harper County in 1950. This contributed 1 million barrels of oil and 1 billion cubic feet of natural gas in Kansas. However, oil production decreased between 1960 and 2010; while gas production remained constant until 2015, especially in Harper County, according to the authors. This interest resulted from the Mississippi Limestone Play that promised a plentiful source of natural gas to companies through hydraulic fracturing or horizontal drilling in Oklahoma and Kansas.  Wastewater disposal, typically, is deposited in the Arbuckle group, which is an aquifer that covers most of the state of Kansas. The Arbuckle group lies on the Precambrian basement that creates fractures and faults in the Arbuckle geological formation. Therefore, if water withdraws and wastewater injections disrupt Precambrian basement, this could lead to frequent earthquakes. Within this study area, there was a correlation between the highest total volume wells and the wells with most documented seismic activity. From their results, earthquakes appeared to lag 2 to 6 months after the wastewater injection.

To ensure their link between wastewater injection from oil and gas deep injection, Rubinstein  and his co-authors investigated if hydraulic fracturing led to seismic activity. They found that this possibility was low in this location because they did not spatially or temporally correlate in their results.

Rubinstein and his authors, also, found that They, also, found that the seismic activity in Kansas is parallel to the activity in Oklahoma which has a similar problem with frequent earthquakes. Recently, the rate of earthquakes decreased in Oklahoma and Kansas. The authors suggested that this was due to the economic and regulatory forces that prompted the decline in injection. In 2016, the Kansas Corporation Commission ordered the reduction of injection in southern Kansas. However, in future research, they will assess how other factors led to the decline in earthquakes.

Source: Rubinstein, J. L., Ellsworth, W.L., Dougherty, S.L. 2018. The 2013-2016 induced earthquakes in harper and sumner Counties, southern kansas. Bulletin of Seismological Society of America 20:20.

Technology Exposed

Image from Zoopah
Image by Zoopah

How much energy do our technologies consume? Researchers from McMaster University answer this question in their study on the trends of global emissions and lifespan of Information and Communication Technology (ICT) devices and services.  They based their study on smart phones, tablets, displays, notebooks, desktops, and data centers.  Based on their current results, ICT infrastructures like data centers and communication networks are the largest contributor to energy consumption and CO2 emissions.

Data centers emit 1314 to 3743 kg CO2-e/year (carbon dioxide equivalent) while they are in use. This is equivalent to 33% of the global greenhouse gas emission (GHGE) footprint by ICT devices in 2010. The average life span of data centers are ten years, and the servers attached to the centers last three to five years. Since the data centers are supporting the internet and telecommunication system, they are in constant use, resulting in higher energy consumption. In comparison, communication networks that encompass telecom operator networks, office networks, and customer premises access contribute to 28% of the global footprint in 2010. Combined, the information of energy consumption of data centers from 2007-2012 will increase by 12% in 2020.

Following data centers and communication networks of ICT greenhouse gas footprints, smart phones will contribute to 11% of energy in 2020, compared to 4% in 2010. Smart phones, specifically Apple IPhones in the study, have an average lifespan of 1.8 to 2 years. Based on the researchers’ model on absolute terms of GHGE footprints, it predicted a 730% increase in GHGE from 2010 to 2020. In 2020, smart phones will release 125 MT CO2-e into the environment. The increase of emissions is due to the short life span of these devices. Therefore, more phones need to be produced due to their ephemeral life span. Planned obsolesce is intentional in technological design, which contributes to a profitable business model for the phone manufactures and telecom industry.

In contrast to data centers, communication networks, and smart phones, the footprints of displays, notebooks, and desktops will decrease in 2020 due the transition to high phone usage.  Below, Figure 1 displays the change of GHGE by ICT category.

comparing global energy consumption in 2010 and 2020.
Figure 1: Data from Belhir and Elmeligi on the relative contribution of each Information Communication Technology categories in 2010 and 2020

Why do these numbers matter? Based on the Paris Agreement, 196 nations agreed to limit global warming below 2°C.  If the production of ICT devices and services continue as is, we will fall short on this commitment. In 2007, the global greenhouse gas emissions were at 1-1.6%; this number could exceed 14% worldwide by 2040 if we continue our current practices. More importantly, these would the global initiative to maintain the global temperature.

paris climate change
Image from WIRED

So, what now?  The researchers suggest that we should instill sustainable practices in the production and operations of data centers and communications through the use of renewable energies. Also, it will be important to raise awareness on global energy consumption from technology. This research provides incite how the environmental impacts of our technology. To meet our global initiative, it will be crucial to adapt a new method.

Source: Lotfi Belkhir, Ahmed Elmeligi. Assessing ICT global emissions footprint: Trends to 2040 & recommendations. Journal of Cleaner Production, 2018; 177: 448 DOI: 10.1016/j.jclepro.2017.12.239

The Perks of Hydro-Powered Dams

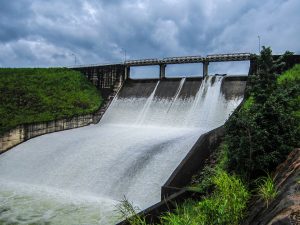
Image of dam

Is it possible to have a dam that contributes to the socioeconomic and energy needs of a community without degrading the surrounding environment?

Researchers from Arizona State University found the answer to this question. They wanted to observe how dams would impact the food security among communities around the Mekong River. Many of these communities rely on the river for their food source and employment. Nutritionally, rural fishing and agricultural communities receive animal protein and vitamin A from the river too. From their study, Results indicate that a design flow that mimics long inter-flood interval and short, strong flood pulses produced higher fish yields than from natural flow restoration. Their results are an extension of previous studies that linked the flood magnitude, duration, and a low period followed by short, strong flood pulses leaded to higher yields in fisheries.

Sabo and his co-authors based their study on the rivers in Lower Mekong Basin. The Mekong River is the twelfth largest in the world, estimating 4350 kilometers in length. It is also the eight largest river that discharges and hosts one of the largest inland fisheries in the world. The river goes through China, Myanmar (Burma), Laos, Thailand, Cambodia, Vietnam.

Due to its large presence across transnational boundaries, it has attracted hydro-power development. According to the researchers, hydropower is a common source of energy for poor, predominantly rural populations. Despite its alternative benefits as a renewable energy, the process could have negative impacts on the environment. For instance, hydrologic alteration from dams could lead to invasion of non-native aquatic species, which would impact the food web structure.

To analyze the relationship between food security and dams, the researchers evaluated the discharges on the Tonle Sap River that connects the Mekong River to the Tonle Sap Lake . The Dai fishery is located on this river too. The Dai fishery has a nursery habitat that houses approximately 300 fish species. In addition to the biodiversity, the fishery is the most valuable and productive (i.e. number of fish caught) in the Lower Mekong Basin according to the researchers.

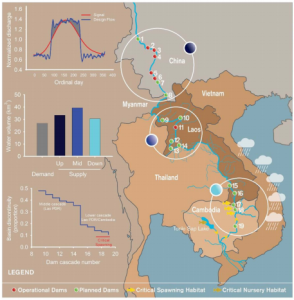
Based on their results, designed flows had a 76% annual increases in yield compared to 47% in annual yield in natural flow restoration along the Tonle Sap and Mekong Rivers.  Designed flows are based on models on flood pulse extent, based on flood magnitude and duration, and net annual anomaly, based on the sum of all positive (wetness) and negative (dryness) anomalies to detail annual discharges. Natural flow is based on the conditions of the water before the installation of dams. Currently, there are projected dams in China, Laos, and Cambodia that would allow water managers to control the flow of the river. This study suggests designed flows prompts higher yields, which would encourage more projects to make dams to insure food security. Below is an image of the proposed dams  by the researchers that support the designed-flow model recommended by them.

Image of Lower Mekong Basin
Proposed Dams in Lower Mekong Basin

Source:

Sabo J.L., Ruhi, A., Holtgrieve, G.W., Elliott, V., Arias, M.E., Bun Ngor, P., Rasanen, T.A., Nam, S. 2017. Designing river flows to improve foo security futures in the Lower Mekong Basin. Science 358: 1053.

How to Reduce the Cost of Renewables?

How do we reduce the cost of renewable energy? Research from the German Institute of Economic Research, commonly known as DWI, evaluated how regulations/policy (as a support system) and risks in financial investments effect the transition to forms of renewable energy like wind powered plants and photovoltaic systems in Germany. In 2014, Germany mandated the use of renewable energies as their main energy instead of optional as it began in 2012. This ruling forced energy companies to invest in renewables. From this, the authors wanted to know the cost associated in these transactions. In their conclusion, they found that companies utilized hedging to cover their financial cost. Hedging offsets the potential losses or gain incurred by the company’s investment. The authors also found that support programs like green certification, market premiums decrease the ability for the company to hedge their investments. As a result, the consumers would absorb the cost of the risk instead of the hedge fund.

Similar to Germany, other European countries adapted renewables as their main electrical source. However, the investment cost varies between the regions in Europe.  The projects in southern and eastern Europe have higher financing than projects in western in northern Europe. This is due to the different funding systems that support the project: a feed-in tariff system, sliding market system, green certificates, and fixed market premiums.

A feed-in tariff system allows developers a fixed tariff on electricity. In this system, the developers bear the risks if the project fails, but they do not have to any other tariffs related to risks, only the fixed tariff.

The sliding market premium  offers premiums to the plant operators. Compared to the feed in tariff system, these fees vary in amount. This systems as to incentive forecasting profits and risk before the project begins. The forecasting can aid the design of the wind power plant and photovoltaic system. Italy, Finland, and the Netherlands adopted this method.

Green certificates and fixed market premiums allow developers to sell electricity at market value. So far, the United Kingdom, Sweden, Poland, Belgium, and Romania used this system. They have some of the highest financing cost.

Although green certificate program seems to better idea, this method impacts the ability to hedge, which negative impacts the consumers due to higher cost for electricity. This report provides incite on the ways we can make renewable energy like wind power plants affordable for the masses. Recently, the cost  renewable technologies have decreased. If there more affordable investment options, this may ease the energy transition.


Source: May, N, Jurgens, I, Neuhoff, K. Renewable energy policy: risk hedging is taking center stage.  2017.. DIW Economic Bulletin 29:40.


How long have we been in a drought?

Researchers from the South African Weather Service discovered that the Western Cape Province of South Africa has experienced mild drought conditions from 1985 to 2016. However, the ramifications from the drought on agricultural and economic activity were not recognized until 2014. In 2014, they encountered their worst water shortage.  According to Botai and her team,  the province experienced their worst water shortage in 113 years from 2014 to 2017.

In reaction to the water shortage, the government imposed water restrictions and rationing on consumers while they attempted to find a supplemental water source. Recently, more restrictions have been implemented to due to the extreme shortage. Currently, the consumers are limited to thirteen gallons of water a day.

Image of a port in South Africa.
South Africa faces an ongoing drought.

The Western Cape Province is home of the Cape Town port. Usually, the weather resembles a Mediterranean climate with hot dry summers and cold winters along the coast. For agricultural production, this climate is ideal for the food they grow like apples, pears, apricots, peaches, nectarines, plums, and grapes. Agricultural production is crucial to the West Cape economy, and the food security of the country.

Due to insufficient rainfall, the province has been declared a disaster region. The west coast of the province and Central Karoo are categorized as an agricultural drought disaster area. This means that there is insufficient soil and subsoil water to promote crop growth. Eden and Central Karoo are the municipalities most impacted by the drought on their crops as a result of warm temperature and evapotranspiration. Typically, the region has intense rainfall during the summers.  In addition to these municipalities, Overberg, Cape Winelands, and West Coast experienced mild drought conditions. However, the lands were traditionally characterized by winter rainfall with sunny and dry summers.

The researchers suggest the drought was offset by decreasing rainfall. Consequently, their water reservoirs are below 30% capacity.

Image of West Cape Province map signifying weather station and relative percipitation.
Figure 1, supplemented by Botai’s article, shows the study area and distribution of select water stations in red circles. The circle sizes are relative to the Mean Annual Precipitation recorded at stations.

Although this trend may appear to be isolated, severe droughts and water shortages have become prevalent in the states in case like California, Texas, Oklahoma; and the world in cases like Ethiopia, Somalia, Afghanistan, Iran, China. This has prompted meetings with officials from government, private sector, and other sectors to address this crisis. In these circumstances, it may be useful to utilize forecast on precipitation to prepare for drought similar to this one.


Source: Botai, C.M., Botai, J.O., de Wit, J.P., Ncongwane, K.P., Adeola, A.M. 2017. Drought Characteristics over the Western Cape Province, South Africa. MDPI 9:876.

Extra Extra: Energy Savings for Dummies

Hand with ways to save by recycling and alternative energy.

Are there cost benefits to conservation? It may appear to be an obvious answer, but researchers at the University of California Davis wanted to quantify this answer. Spang and his co-authors investigated how much the state of California saved on electricity and greenhouse emission reductions after the Governor of California mandated a 25% reduction and water consumption statewide in 2015. On April 1, 2015, Governor Brown passed Executive Order B-29-15 in response to the four-year drought that impacted 48% of the state’s surface water resources. Consequently, the drought impaired 542,000 acres of land, $2.74 billion of the state’s revenue, and approximately 21,000 jobs according to the researchers.  This was the first bill that regulated urban water consumption in their state history.

Water and energy are interdependent.  Water is needed to produce energy for fuels and electricity generation. In California, energy is needed to transport water resources across the state. Additionally, energy is needed to treat water and waste water. This is way the authors decided to calculate the savings for energy. By conserving energy, they can reduce greenhouse gas emitted into the air.

For their study, they observed energy use from June 2015 to May 2016. During this time, California saved 524,000 million gallons (MG) in water, which is a 24.5% decreased from their 2013 baseline. From this, California saved $230 MG-1 on water conservation. In energy, they saved 1830 gigawatts statewide (GWh).  Because of these energy savings, they avoided approximately 521,000 metric ton (MT) CO2e in greenhouse gas emission. This is equivalent to taking 111,000 average cars off the road annually.

The hydrologic region that saved the most was the South Coast region (237, 200 MG), which has populous cities like Los Angeles and San Diego. The North Lahontan region (1,400 MG) had the lowest savings, which has sparsely populated cities like Susanville and Truckee, California.

After comparing the general cost benefits, the researchers compared the cost benefits from the statewide mandate and the energy programs of investor-owned utilities. They found that they saved 11% more on energy than investor-owned electricity utilities’ efficiency programs.

These findings could be useful in other advertisements for conservation efforts. If people knew the savings and environmental benefit from this mandate, this could encourage people to reduce consumption.

Journal Citation:

Spang, E.S., Holguin, A.J., Loge, F.J. 2018. The estimated impacts of California’s urban water conservation mandate on electricity consumption and greenhouse gas emissions. Environmental Research Letters 13:1.

Cooling powers of reflection

Image of city and water.

Researchers found a way to reduce the effects of greenhouse gas through regional land radiative management (LRMreg). As an alternative approach in climate engineering and climate adaption, this method alters the radiative properties of agricultural land and high population areas to change the average temperature, extreme temperature, and precipitation within the region. For this study, the researchers focused on climate and weather changes in North America, Europe, and Asia.

The use of LRMreg is seen as a better method than using the global solar radiation management (SRMglob) because it does not use sulfate aerosol injection (SAI). SAI is met with contention and controversy because it can lead to the depletion of the ozone layer and contribute to the increase of carbon dioxide (CO2) leading to ocean acidification. Furthermore, this process would decrease monsoon precipitation, and prompt higher temperature at the regional level. However, this approach is for scientists that want to reduce global mean temperature, instead of the extreme regional temperatures. Furthermore, there is concern that this technology would encourage higher CO2 levels rather than adapting ways to mitigate or eliminate them.

Even though the researchers portray LRMreg as the better option, there are still risks associated with this method. For instance, this method could increase the use of herbicide and other chemicals to control crop infestations. Secondly, there is a high chance of second crops freezing which can alter the plant management. Similar to SRMglob, LRMreg can increase CO2 concentration leading to ocean acidification.  Despite this, LRMreg presents as an ideal approach because it counteracts the effects of climate change at the regional and local level in densely populated and agricultural regions. Results from their study indicate that LRMreg reduces the effects of extreme hot and dry temperature that would impact human health and crop production. In agricultural production, this approach increases water use efficiency for dry land and crops, and enhances drying techniques during the intercropping period. In urban space, white roofs or reflective paving could reduce the use of air conditioning, which would provide energy savings.

Seneviratne and coauthors, argue that LRMreg is worth the risks because it provides efficiencies to land and urban management. Moreover, the results in their study indicated that the LRMreg could reduce hot extreme temperatures in densely populated and crop-producing regions by 2-3 C°. This could be helpful because cities and agriculture are crucial to the global economy.

Citation:

Seneviratene, S.I., Phipps, S.J., Pitman, A.J., Hirsch, A.L., Davin, E.L., Donat, M.D., Hirschi M., Lenton, A., Wilhelm, M., Kravitz, B. 2018. Land radiative management as a contributor to regional –scale climate adaption and mitigation. Nature Geoscience 11:88-96.