 Weather patterns are on the fritz all around the world. Georgia is being inundated with rain, Tropical Storm Ketsana is causing intense flooding in the Philippines, Kenya is in its third year of severe drought… is this climate change?
Although similar and very much related, there is a distinct difference between “climate” and “weather.” The key difference is time. Weather refers to the way the atmosphere behaves in a short period of time- days, weeks, and months. We often think of weather in terms of its effects upon our day-to-day lives. Climate on the other hand, is the average of weather patterns throughout time and across space. In this way, climate is rather predictable- it’s the weather we expect for a given place at a given time of year.

Ice Core Sampling
Geologists have established an impressive record of ocean and atmospheric temperatures, spanning millions of years. By extracting air bubbles from ice cores, scientists (geologists, biologists, biochemists, soil scientists… the list goes on) have also created an array of corresponding CO2 concentration levels. What we see is a strong correlation between CO2 levels and temperature- namely, as CO2 levels rise, Earth warms; as CO2levels fall, temperatures fall and Earth cools. Geologists estimate hundreds of millions of years ago, the atmosphere contained as much as 4,000 ppm (parts per million) of CO2. That number is astronomically high when we think of the upper 300-ppm limit we are trying to maintain today. So what do these numbers tell us?
Scientists use “climate sensitivity” measurements to determine the potential magnitude of future global warming. Climate sensitivity measures the extent the planet will warm in response to future green house gas emissions. Often this term refers to the expected temperature change in response to a doubling of pre-industrial atmospheric CO2 concentrations.
Evidence from the “Last Glacial Maximum“, 21,000 years ago, show CO2 levels to be about 50% of what they are now. Sea levels were about 100 meters lower, and vast ice sheets covered the northern hemisphere. Carbon Dioxide concentrations were about half of what they are today, and compiled data indicates that average global temperature was about 5° C cooler. Using this information scientists determined that the equilibrium climate sensitivity for that time period was 2.3 -3.7° C.

Single Pore on Fern
To determine how the Earth may respond to even higher levels of C02, scientist must look further back into deep planet history. Because there is no direct way to measure atmospheric CO2 levels hundreds of millions of years back, scientist have developed proxy measure, such as pores on fossil leaves, to estimate CO2 concentrations.
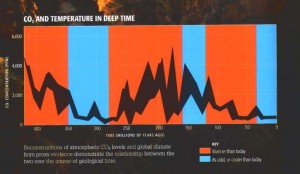
"CO2 and Temperature in Deep Time" From: Kump and Mann. "Dire Predictions:Understanding Global Warming" 2008. pg. 84.
The graph, “CO2 and Temperature in Deep Time” depicted on page 84 of Dire Predictions shows scientific estimates of climatic pattern for the last 400 million years. CO2 levels throughout the last 400 million years ago were often incredibly high, twice reaching concentrations over 4000 ppm. Warm eras and cool eras paralleled the rise and fall of CO2 levels very closely. In comparison to past periods of time, our current climate is relatively cool and history would suggest we are due for a warming.
Climate change of the past is reconfirming what science of the present clearly shows; CO2 levels are increasing dramatically, as they do the climate is warming. And with that warming comes changes in precipitation patterns, temperatures, and extreme weather events around the world. While the recent weather patterns in Georgia, Kenya and the Philippines cannot be entirely pinned on climate change, they are certainly signs that things are changing.
Tags: climate change, Danielle Hoffman, historic climate change, weather